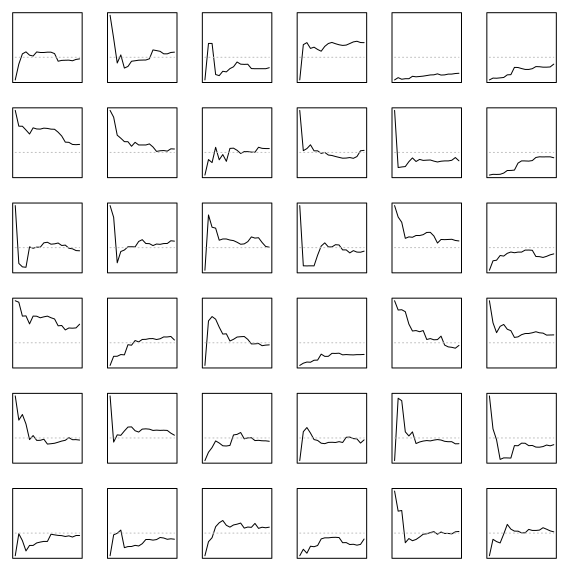
library(MASS)

set.seed(1)
n = 6
layout(matrix(c(1:(n^2)),n))
par(mar = c(1,1,1,1))

for (i in 1:(n^2)) {
  x <- mvrnorm(20, c(0,0), matrix(c(1,-0.3,-0.3,1),2))           ### generate data
  s <- sapply(2:20, FUN = function(i) cor(x[1:i,1],x[1:i,2]))    ### compute cum correlation
  plot(2:20, s,
       type = "l", col = rgb(0,0,0,1), xlim = c(2,20), ylim = c(-1,1),
       xlab = "", ylab = "", xaxt = "n", yaxt = "n")             ### plot correlation curve
  lines(c(2,20),c(1,1)*-0.3,col = 8, lty = 3)                    ### add asymptote at -0.3
}
    library(MASS)

    set.seed(1)
    n = 6
    layout(matrix(c(1:(n^2)),n))
    par(mar = c(1,1,1,1))

    for (i in 1:(n^2)) {
      x <- mvrnorm(20, c(0,0), matrix(c(1,-0.3,-0.3,1),2))
            ### generate data
      s <- sapply(2:20, FUN = function(i) cor(x[1:i,1],x[1:i,2]))
           ### compute cum correlation
      plot(2:20, s,
           type = "l", col = rgb(0,0,0,1), xlim = c(2,20),
               ylim = c(-1,1),
           xlab = "", ylab = "", xaxt = "n", yaxt = "n")
          ### plot correlation curve
      lines(c(2,20),c(1,1)*-0.3,col = 8, lty = 3)
              ### add asymptote at -0.3
    }


