In your example, suppose you use $n = 100$ Bernoulli trials to test $H_0: p = 0.5$$H_0: p = 0.6$ against $H_a: p < 0.6)$ at the 5% level. Then $H_0$ saysprovides the 'null distribution' $X \sim\mathsf{Binom}(n=100, p=0.6).$
YouIn order to test at the 5% level, you want to find $c$ such that $P(X \le c) = 0.05.$ More precisely, for the discrete binomial distribution, you want the largest $c$ such that $P(X \le c) \le 0.05.$ In R, we see that $c = 51,$ actually givingresulting in a test at level 4.2% (as close to 5% as possible without going above 5%).
qbinom(.05, 100, .6)
[1] 52               # apprx 52
pbinom(52, 100, .6)
[1] 0.06378918       # 52 cuts too much from tail
pbinom(51, 100, .6)
[1] 0.04230142       # so use c=51, alpha = 4.2%
Now suppose you run the $n=100$ Bernoulli trials, getting $x = 48$ Successes in $n=100.$ Then the P-value is $0.01$ [again found using mathsf{Binom}(100, 0.6)].$$\mathsf{Binom}(100, 0.6)].$
You can use the P-value to reject at any desired significance level. IYou can reject at the 5% level because the P-value is $0.01 \le 0.05 = 5\%.$ Similarly, you can reject at the 2% level. [To be really fussy, you cannot quite reject at the 1% level because the P-value is just a bit above $0.01.]$
If you use a (continuous) normal approximation to the (discrete) binomial distribution you can fool yourself into believing that you are testing exactly at the 5% level, but $c=51.94$ is not an integer, and the P-value resulting from $x = 48$ is very close to $0.01.$ [In R, I have used the 48.5 instead of 48, as a 'continuity correction'. If you standardize and use printed standard normal tables, then rounding will typically result in slightly different approximate values.]
qnorm(.05, 60, sqrt(24))
[1] 51.9419
pnorm(48.5, 60, sqrt(24))
[1] 0.009451772
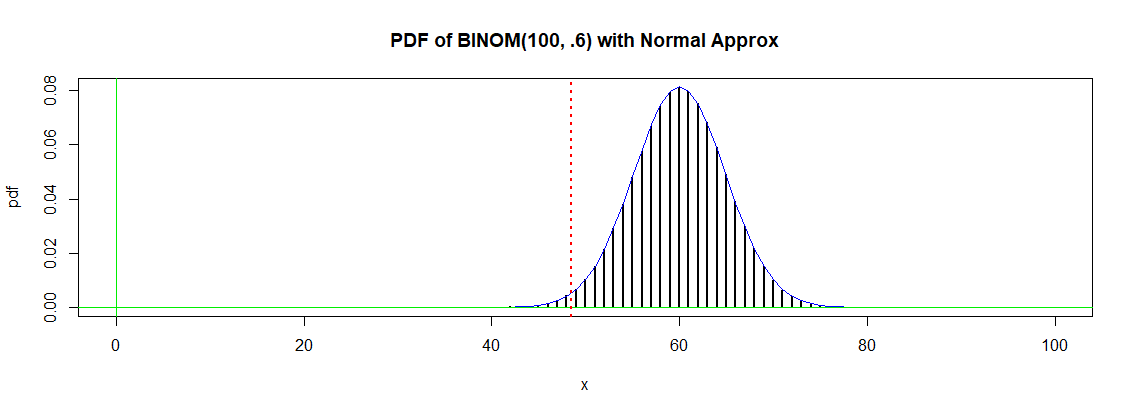
The plot below shows the relevant binomial distribution (bars) and the approximating normal distribution (curve). The P-value is the the probability to the left of the vertical dotted line, whichever distribution you use.
R code for graph:
x = 0:100;  p = .6
pdf = dbinom(x, 100, p)
hdr = "PDF of BINOM(100, .6) with Normal Approx"
plot(x, pdf, type="h", lwd=2, main=hdr)
 curve(dnorm(x, 60, sqrt(24)), add=T, col="blue")
 abline(h=0, col="green2"); abline(v=0, col="green2")
 abline(v=48.5, col="red", lwd=2, lty="dotted")

