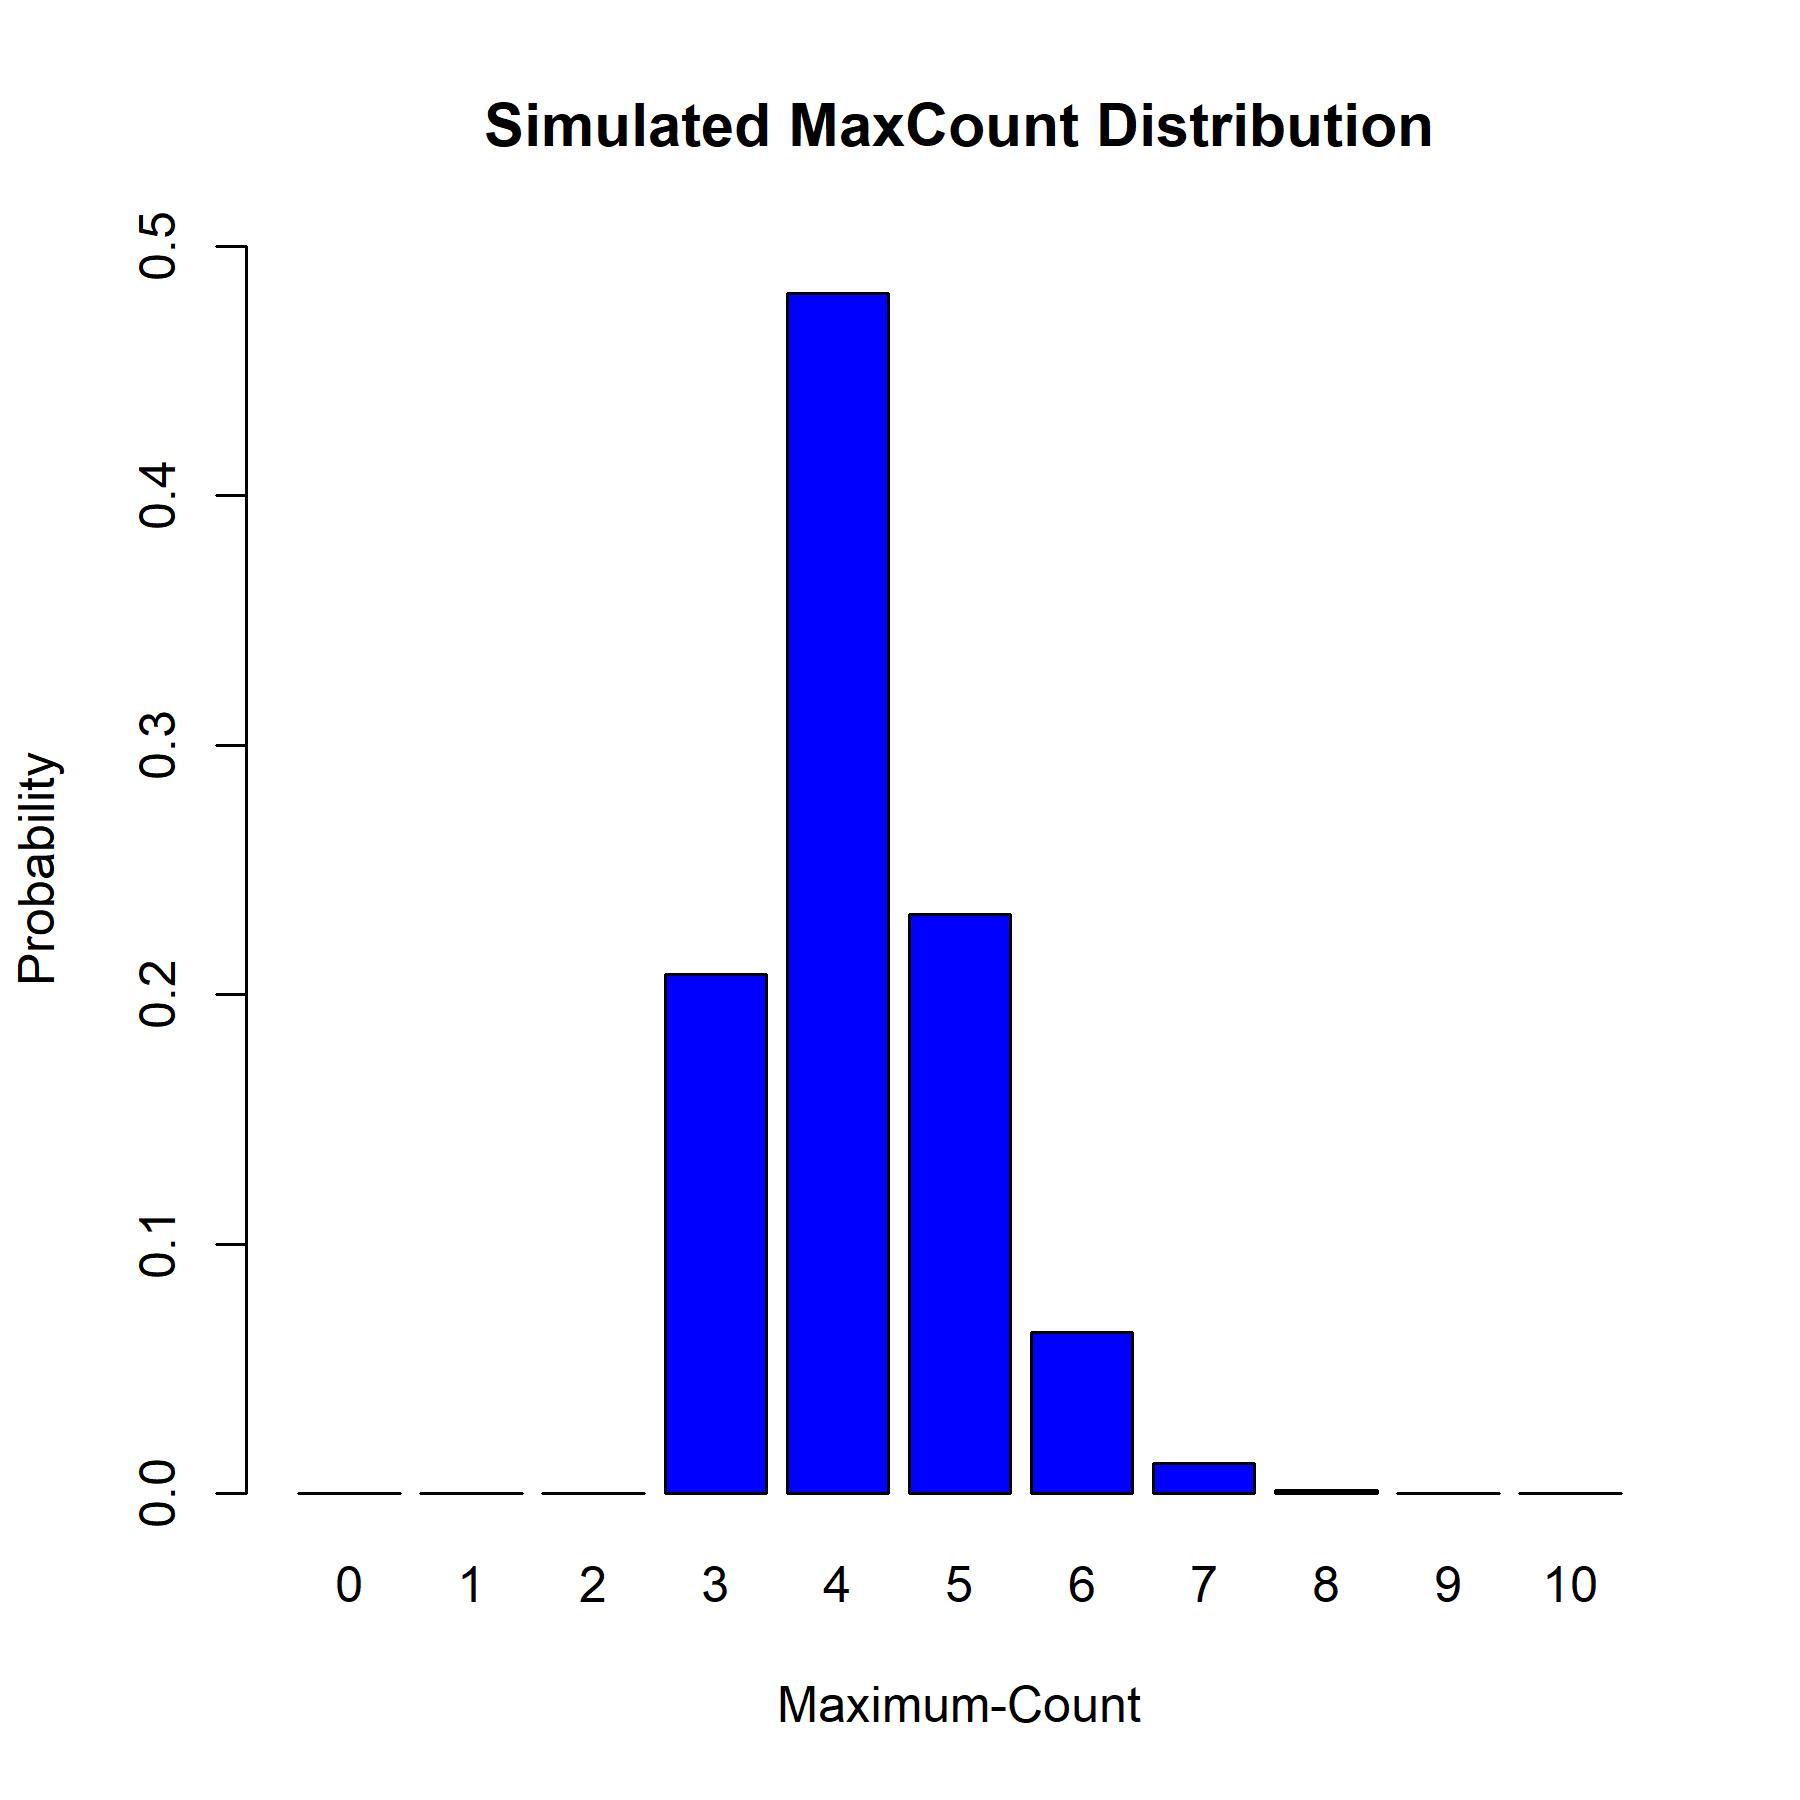
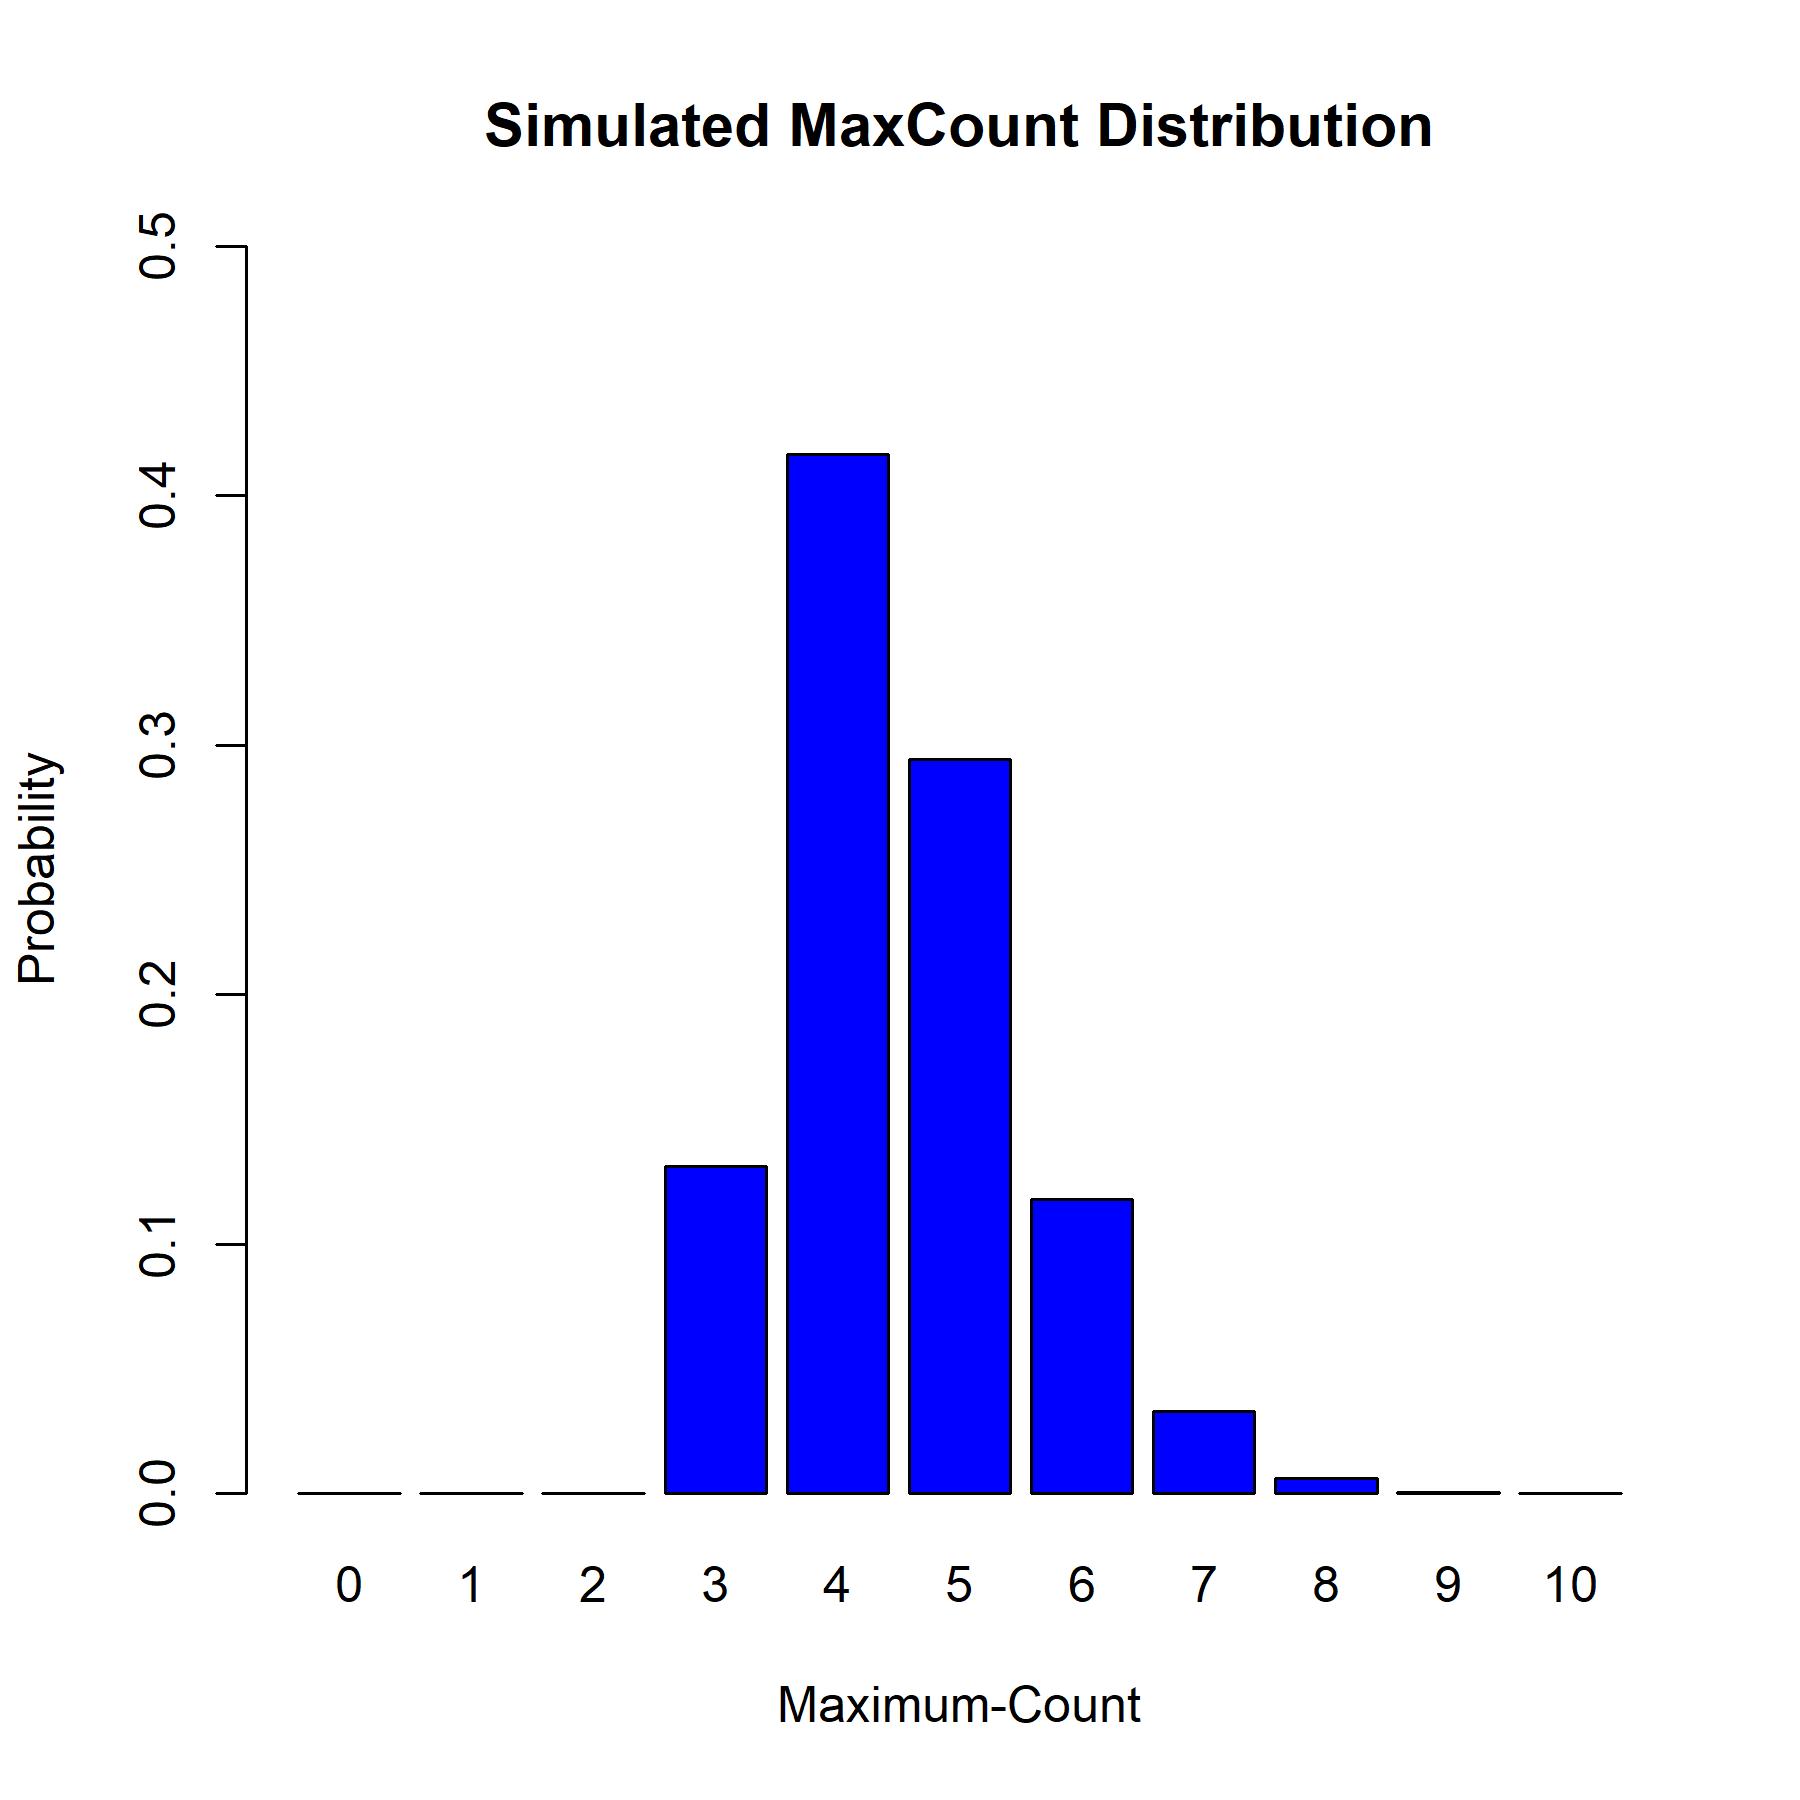
This is quite an interesting question, since it involves probability pertaining to overlapping random sets. I'm going to solve this for a more general problem where we have $K$ servers. The solution turns out to relate to the maximum-count statistic in a multinomial distribution. By my calculations, the probability of interest is approximately $0.45214$ ---i.e., you have a little over a 45% chance that at least half the serveres will run Test B simultaneously at some point in the hour.
Simulate the distribution: It is fairly simple to get a simulated estimate for the distribution of the maximum-count statistic using R. In the code below I will simulate ten-million outcomes of the maximum-count statistic for the case with $K=10$ servers (as in your problem). The simulated probability of having Test B running on at least half the servers simultaneously is $\mathbb{P}(M_{10} \geqslant 5) \approx 0.3110009$$\mathbb{P}(M_{10} \geqslant 5) \approx 0.45214$.
#Set the parameters
K <- 10
SIMS <- 1e7

#Set up the count matrix
COUNTS <- matrix(0, nrow = SIMS, ncol = 5)
rownames(COUNTS) <- sprintf('Simulation[%s]', 1:SIMS)
colnames(COUNTS) <- c(sprintf('Outcome[%s]', 1:4), 'MaxCount')

#Generate a large number of count vectors
set.seed(418184220)
for (i in 1:SIMS) {
   SAMPLE <- sample.int(4, size = K, replace = TRUE, prob = c(2, 1, 1, 2)/6)
   for (x in 1:4) { COUNTS[i, x] <- sum(SAMPLE == x) }
   COUNTS[i, 5] <- max(COUNTS[i, 1:4]) }

#Compute approximate distribution
DIST <- rep(0, K+1)
names(DIST) <- sprintf('MaxCount[%s]', 0:K)
for (M in 0:K) { DIST[M+1] <- sum(COUNTS[, 5] == M)/SIMS }

#Plot the simulated distribution
barplot(DIST, names.arg = 0:K, ylim = c(0, 0.5), col = 'blue',
        main = 'Simulated MaxCount Distribution',
        xlab = 'Maximum-Count', ylab = 'Probability')

#Compute the probability of interest
sum(DIST[6:11])

[1] 0.3110009  45214


