appended answer 536314 as supplemental
Source Link
whuber
  • 333.5k
  • 63
  • 792
  • 1.3k

Thank you very much for your answer.

Indeed I don't have a lot of observation... In reality it is an analysis based on 10 years of data. But for the species data and the frequentation data to match I had to gather them by year and by area. So that makes only 32 observations...

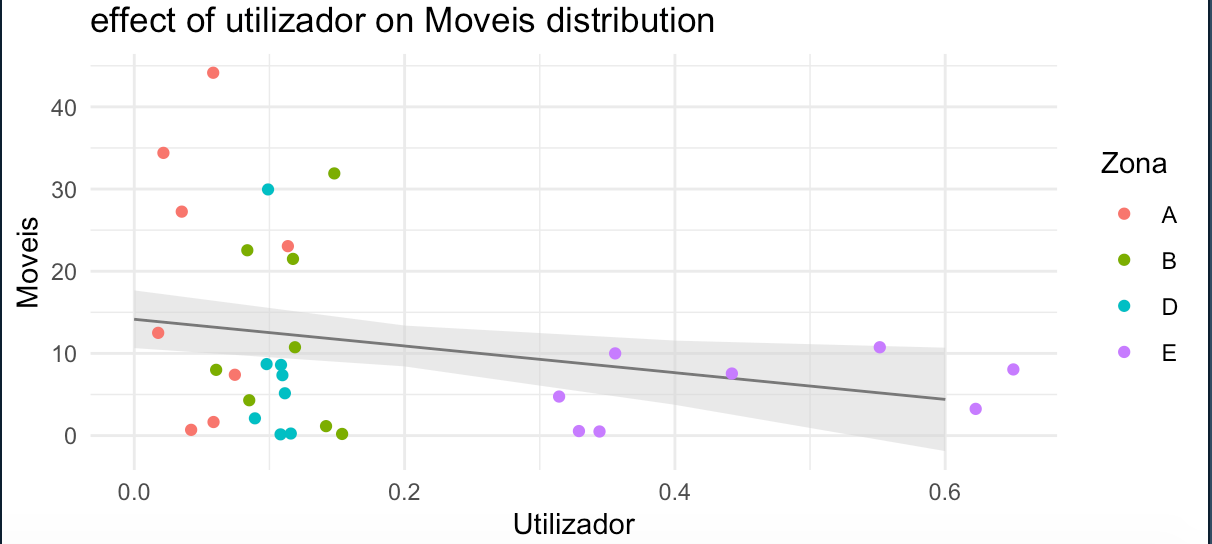
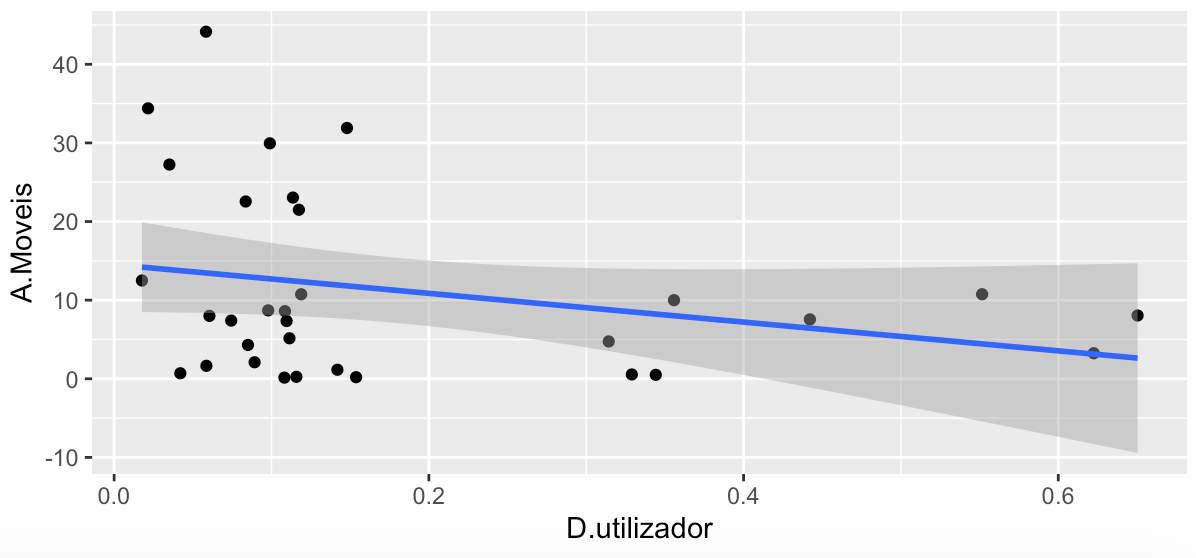
You can interpret the effeect size as: each 1 unit change in D.utilizador is associated with a 16.255 change in A.Moveis, in the oppostie direction.

Thank you !!

It means that, if the intercept is atually zero, the probability of observing the data that you did observed (or data more extreme) is lower than some pre-defined threshold (often 0.05)

Ok, so it makes sense I think

I doubt it because 4 groups is insufficient for any mixed effects model fitted with lme4 or any other frequentist mixed model package. 32 is likely to be too small also as a total sample size.

Do you know if an other model could be more efficient? Maybe a signe linear regression?
added 75 characters in body
Source Link

Is there a more suitable method than a mixed-effect linear regression?

Thank you in advance for you help.

Thank you in advance for you help.

Is there a more suitable method than a mixed-effect linear regression?

Thank you in advance for you help.

added 206 characters in body
Source Link

Here's the graph. the second one is a prediction plot. M1 Plot

M1 perdiction plot

Thank you in advance for you help.

Thank you in advance for you help.

Here's the graph. the second one is a prediction plot. M1 Plot

M1 perdiction plot

Thank you in advance for you help.

Source Link
Loading