added 1 character in body
Source Link
BruceET
  • 57.6k
  • 2
  • 36
  • 94

Example: Suppose you have $n = 67$ observations from a normal population with unknown population mean $\mu$ and standard deviation $\sigma.$ You wish to test $H_0: \mu = 106$ against $H_a: \mu \ne 106.$ and you want the power of a one sample t test at the 5% level to be about 90% when the true mean is $\mu = 100.$

Then a simple simulation in R shows that $n = 67$ observations is sufficient to give the desired power:

set.seed(2021)
pv = replicate(10^6, t.test(rnorm(67, 100, 15), mu = 106)$p.val)
mean(pv <= 0.05)
[1] 0.896917

However, the P-values corresponding to t statistics computed after $n = 2, 3, \dots, 67$ may (temporarily) be smaller than 5% for some values of $n$ smaller than $67.$

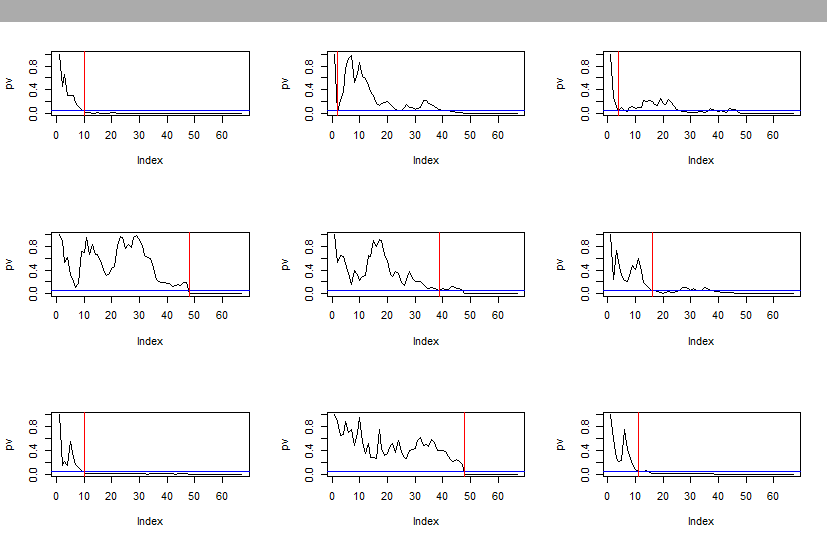
Below we plots of such 'intermediate' P-values for nine experiments with $n = 67.$ About 80% samples will show P-values below $0.05$ exactly at $n = 67.$ That may be the first step at which the value is small enough to reject, but that is typically not the case. Clearly, it would not be appropriate to make a decision based on the first step at which a P-value is smaller than 5%.

enter image description here

Of course, some of these P-value traces may never dip as low as $0.05$ within $n = 67$ observations.

R code for one trace is shown below:

pv = numeric(67)
x = rnorm(67, 100, 15)
pv = numeric(67);  pv[1]= 1  # no t stat for n=1
for(i in 2:47) 
 { pv[i] = t.test(x[1:i], mu=106)$p.val }
plot(pv, type="l", ylim=0:1)
 abline(h=.05, col="blue")
 m = min(which(pv < .05));m
 abline(v=m, col="red") 

Example: Suppose you have $n = 67$ observations from a normal population with unknown population mean $\mu$ and standard deviation $\sigma.$ You wish to test $H_0: \mu = 106$ against $H_a: \mu \ne 106.$ and you want the power of a one sample t test at the 5% level to be about 90% when the true mean is $\mu = 100.$

Then a simple simulation in R shows that $n = 67$ observations is sufficient to give the desired power:

set.seed(2021)
pv = replicate(10^6, t.test(rnorm(67, 100, 15), mu = 106)$p.val)
mean(pv <= 0.05)
[1] 0.896917

However, the P-values corresponding to t statistics computed after $n = 2, 3, \dots, 67$ may (temporarily) be smaller than 5% for $n$ smaller than $67.$

Below we plots of such 'intermediate' P-values for nine experiments with $n = 67.$ About 80% samples will show P-values below $0.05$ exactly at $n = 67.$ That may be the first step at which the value is small enough to reject, but that is typically not the case. Clearly, it would not be appropriate to make a decision based on the first step at which a P-value is smaller than 5%.

enter image description here

Of course, some of these P-value traces may never dip as low as $0.05$ within $n = 67$ observations.

R code for one trace is shown below:

pv = numeric(67)
x = rnorm(67, 100, 15)
pv = numeric(67);  pv[1]= 1  # no t stat for n=1
for(i in 2:47) 
 { pv[i] = t.test(x[1:i], mu=106)$p.val }
plot(pv, type="l", ylim=0:1)
 abline(h=.05, col="blue")
 m = min(which(pv < .05));m
 abline(v=m, col="red") 
Example: Suppose you have $n = 67$ observations from a normal population with unknown population mean $\mu$ and standard deviation $\sigma.$ You wish to test $H_0: \mu = 106$ against $H_a: \mu \ne 106.$ and you want the power of a one sample t test at the 5% level to be about 90% when the true mean is $\mu = 100.$

Then a simple simulation in R shows that $n = 67$ observations is sufficient to give the desired power:

set.seed(2021)
pv = replicate(10^6, t.test(rnorm(67, 100, 15), mu = 106)$p.val)
mean(pv <= 0.05)
[1] 0.896917

However, the P-values corresponding to t statistics computed after $n = 2, 3, \dots, 67$ may be smaller than 5% for some values of $n$ smaller than $67.$

Below we plots of such 'intermediate' P-values for nine experiments with $n = 67.$ About 80% samples will show P-values below $0.05$ exactly at $n = 67.$ That may be the first step at which the value is small enough to reject, but that is typically not the case. Clearly, it would not be appropriate to make a decision based on the first step at which a P-value is smaller than 5%.

enter image description here

Of course, some of these P-value traces may never dip as low as $0.05$ within $n = 67$ observations.

R code for one trace is shown below:

pv = numeric(67)
x = rnorm(67, 100, 15)
pv = numeric(67);  pv[1]= 1  # no t stat for n=1
for(i in 2:47) 
 { pv[i] = t.test(x[1:i], mu=106)$p.val }
plot(pv, type="l", ylim=0:1)
 abline(h=.05, col="blue")
 m = min(which(pv < .05));m
 abline(v=m, col="red") 
Source Link
BruceET
  • 57.6k
  • 2
  • 36
  • 94

Example: Suppose you have $n = 67$ observations from a normal population with unknown population mean $\mu$ and standard deviation $\sigma.$ You wish to test $H_0: \mu = 106$ against $H_a: \mu \ne 106.$ and you want the power of a one sample t test at the 5% level to be about 90% when the true mean is $\mu = 100.$

Then a simple simulation in R shows that $n = 67$ observations is sufficient to give the desired power:

set.seed(2021)
pv = replicate(10^6, t.test(rnorm(67, 100, 15), mu = 106)$p.val)
mean(pv <= 0.05)
[1] 0.896917

However, the P-values corresponding to t statistics computed after $n = 2, 3, \dots, 67$ may (temporarily) be smaller than 5% for $n$ smaller than $67.$

Below we plots of such 'intermediate' P-values for nine experiments with $n = 67.$ About 80% samples will show P-values below $0.05$ exactly at $n = 67.$ That may be the first step at which the value is small enough to reject, but that is typically not the case. Clearly, it would not be appropriate to make a decision based on the first step at which a P-value is smaller than 5%.

enter image description here

Of course, some of these P-value traces may never dip as low as $0.05$ within $n = 67$ observations.

R code for one trace is shown below:

pv = numeric(67)
x = rnorm(67, 100, 15)
pv = numeric(67);  pv[1]= 1  # no t stat for n=1
for(i in 2:47) 
 { pv[i] = t.test(x[1:i], mu=106)$p.val }
plot(pv, type="l", ylim=0:1)
 abline(h=.05, col="blue")
 m = min(which(pv < .05));m
 abline(v=m, col="red")