added 9 characters in body
Source Link
BruceET
  • 57.6k
  • 2
  • 36
  • 94

Sometimes graphical displays give clues about important differences that formal tests do not.

Consider the following two samples from different distributions, but with similar means and standard deviations.

set.seed(906)
x1 = rgamma(1000, 4, .1)
mean(x1);  sd(x1)
[1] 39.79927
[1] 19.58579
x2 = rnorm(1000, 40, 20)
mean(x2);  sd(x2)
[1] 39.23941
[1] 19.78541

Boxplots show that the normal sample (top) takes negative values, while the gamma sample does not.

boxplot(x1, x2, col="skyblue2", horizontal=T, pch=20)

enter image description here

In this example a two-sample Kolmogorov-Smirnov test that the two samples are from the same population rejects at the 5% level.

ks.test(x1, x2)

        Two-sample Kolmogorov-Smirnov test

data:  x1 and x2
D = 0.064, p-value = 0.03328
alternative hypothesis: two-sided

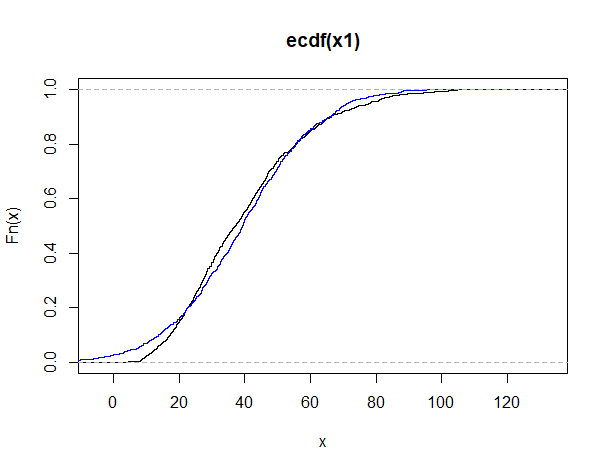
Empirical CDF (ECDF) plots look somewhat similar, but do show that the normal sample (blue) takes negative values. The K-S statistic $D$ is the maximum vertical distance between the two plots.

plot(ecdf(x1))
lines(ecdf(x2), col="blue")

enter image description here

It is not surprising that a Welch 2-sample t test fails to find a difference between means and that a 2-sample F test fails to find a difference between variances. (There are no differences to be found in either test, and both tests assume both samples are normal.)

t.test(x1, x2)$p.val
[1] 0.5248905
var.test(x1, x2)$p.val
[1] 0.7486433

Moreover, smaller samples from the same two distributions are not detected as different by the K-S test, while boxplots hint that the distributions are not the same. [The two-sample K-S test is not known for excellent power.]

set.seed(2021)
y1 = rgamma(100, 4, .1)
y2 = rnorm(100, 40, 20)
ks.test(y1,y2)$p.val 
[1] 0.05410262

enter image description here

Also, the K-S test had trouble distinguishing between two samples of a thousand observations from a gamma distribution with shape parameter 6 and a normal population with matching means and standard deviations. [Not shown.] A gamma distribution with shape parameter 6 is somewhat less skewed than one with shape parameter 54.

Sometimes graphical displays give clues about important differences that formal tests do not.

Consider the following two samples from different distributions, but with similar means and standard deviations.

set.seed(906)
x1 = rgamma(1000, 4, .1)
mean(x1);  sd(x1)
[1] 39.79927
[1] 19.58579
x2 = rnorm(1000, 40, 20)
mean(x2);  sd(x2)
[1] 39.23941
[1] 19.78541

Boxplots show that the normal sample (top) takes negative values, while the gamma sample does not.

boxplot(x1, x2, col="skyblue2", horizontal=T, pch=20)

enter image description here

In this example a two-sample Kolmogorov-Smirnov test that the two samples are from the same population rejects at the 5% level.

ks.test(x1, x2)

        Two-sample Kolmogorov-Smirnov test

data:  x1 and x2
D = 0.064, p-value = 0.03328
alternative hypothesis: two-sided

Empirical CDF (ECDF) plots look somewhat similar. The K-S statistic $D$ is the maximum vertical distance between the two plots.

plot(ecdf(x1))
lines(ecdf(x2), col="blue")

enter image description here

It is not surprising that a Welch 2-sample t test fails to find a difference between means and that a 2-sample F test fails to find a difference between variances. (There are no differences to be found in either test, and both tests assume both samples are normal.)

t.test(x1, x2)$p.val
[1] 0.5248905
var.test(x1, x2)$p.val
[1] 0.7486433

Moreover, smaller samples from the same two distributions are not detected as different by the K-S test, while boxplots hint that the distributions are not the same. [The two-sample K-S test is not known for excellent power.]

set.seed(2021)
y1 = rgamma(100, 4, .1)
y2 = rnorm(100, 40, 20)
ks.test(y1,y2)$p.val 
[1] 0.05410262

enter image description here

Also, the K-S test had trouble distinguishing between two samples of a thousand observations from a gamma distribution with shape parameter 6 and a normal population with matching means and standard deviations. [Not shown.] A gamma distribution with shape parameter 6 is somewhat less skewed than one with shape parameter 5.

Sometimes graphical displays give clues about important differences that formal tests do not.

Consider the following two samples from different distributions, but with similar means and standard deviations.

set.seed(906)
x1 = rgamma(1000, 4, .1)
mean(x1);  sd(x1)
[1] 39.79927
[1] 19.58579
x2 = rnorm(1000, 40, 20)
mean(x2);  sd(x2)
[1] 39.23941
[1] 19.78541

Boxplots show that the normal sample (top) takes negative values, while the gamma sample does not.

boxplot(x1, x2, col="skyblue2", horizontal=T, pch=20)

enter image description here

In this example a two-sample Kolmogorov-Smirnov test that the two samples are from the same population rejects at the 5% level.

ks.test(x1, x2)

        Two-sample Kolmogorov-Smirnov test

data:  x1 and x2
D = 0.064, p-value = 0.03328
alternative hypothesis: two-sided

Empirical CDF (ECDF) plots look somewhat similar, but do show that the normal sample (blue) takes negative values. The K-S statistic $D$ is the maximum vertical distance between the two plots.

plot(ecdf(x1))
lines(ecdf(x2), col="blue")

enter image description here

It is not surprising that a Welch 2-sample t test fails to find a difference between means and that a 2-sample F test fails to find a difference between variances. (There are no differences to be found in either test, and both tests assume both samples are normal.)

t.test(x1, x2)$p.val
[1] 0.5248905
var.test(x1, x2)$p.val
[1] 0.7486433

Moreover, smaller samples from the same two distributions are not detected as different by the K-S test, while boxplots hint that the distributions are not the same. [The two-sample K-S test is not known for excellent power.]

set.seed(2021)
y1 = rgamma(100, 4, .1)
y2 = rnorm(100, 40, 20)
ks.test(y1,y2)$p.val 
[1] 0.05410262

enter image description here

Also, the K-S test had trouble distinguishing between two samples of a thousand observations from a gamma distribution with shape parameter 6 and a normal population with matching means and standard deviations. [Not shown.] A gamma distribution with shape parameter 6 is somewhat less skewed than one with shape parameter 4.

added 9 characters in body
Source Link
BruceET
  • 57.6k
  • 2
  • 36
  • 94

Sometimes graphical displays give clues about important differences that formal tests do not.

Consider the following two samples from different distributions, but with similar means and standard deviations.

set.seed(906)
x1 = rgamma(1000, 4, .1)
mean(x1);  sd(x1)
[1] 39.79927
[1] 19.58579
x2 = rnorm(1000, 40, 20)
mean(x2);  sd(x2)
[1] 39.23941
[1] 19.78541

Boxplots show that onethe normal sample (top) takes negative values, while the othergamma sample does not.

boxplot(x1, x2, col="skyblue2", horizontal=T, pch=20)

enter image description here

In this example a two-sample Kolmogorov-Smirnov test that the two samples are from the same population rejects at the 5% level.

ks.test(x1, x2)

        Two-sample Kolmogorov-Smirnov test

data:  x1 and x2
D = 0.064, p-value = 0.03328
alternative hypothesis: two-sided

Empirical CDF (ECDF) plots look somewhat similar. The K-S statistic $D$ is the maximum vertical distance between the two plots.

plot(ecdf(x1))
lines(ecdf(x2), col="blue")

enter image description here

It is not surprising that a Welch 2-sample t test fails to find a difference between means and that a 2-sample F test fails to find a difference between variances. (There are no differences to be found in either test, and both tests assume both samples are normal.)

t.test(x1, x2)$p.val
[1] 0.5248905
var.test(x1, x2)$p.val
[1] 0.7486433

Moreover, smaller samples from the same two distributions are not detected as different by the K-S test, while boxplots hint that the distributions are not the same. [The two-sample K-S test is not known for excellent power.]

set.seed(2021)
y1 = rgamma(100, 4, .1)
y2 = rnorm(100, 40, 20)
ks.test(y1,y2)$p.val 
[1] 0.05410262

enter image description here

Also, the K-S test had trouble distinguishing between two samples of a thousand observations from a gamma distribution with shape parameter 6 and a normal population with matching means and standard deviations. [Not shown.] A gamma distribution with shape parameter 6 is somewhat less skewed than one with shape parameter 5.

Sometimes graphical displays give clues about important differences that formal tests do not.

Consider the following two samples from different distributions, but with similar means and standard deviations.

set.seed(906)
x1 = rgamma(1000, 4, .1)
mean(x1);  sd(x1)
[1] 39.79927
[1] 19.58579
x2 = rnorm(1000, 40, 20)
mean(x2);  sd(x2)
[1] 39.23941
[1] 19.78541

Boxplots show that one sample takes negative values, while the other does not.

boxplot(x1, x2, col="skyblue2", horizontal=T, pch=20)

enter image description here

In this example a two-sample Kolmogorov-Smirnov test that the two samples are from the same population rejects at the 5% level.

ks.test(x1, x2)

        Two-sample Kolmogorov-Smirnov test

data:  x1 and x2
D = 0.064, p-value = 0.03328
alternative hypothesis: two-sided

Empirical CDF (ECDF) plots look similar. The K-S statistic $D$ is the maximum vertical distance between the two plots.

plot(ecdf(x1))
lines(ecdf(x2), col="blue")

enter image description here

It is not surprising that a Welch 2-sample t test fails to find a difference between means and that a 2-sample F test fails to find a difference between variances. (There are no differences to be found in either test, and both tests assume both samples are normal.)

t.test(x1, x2)$p.val
[1] 0.5248905
var.test(x1, x2)$p.val
[1] 0.7486433

Moreover, smaller samples from the same two distributions are not detected as different by the K-S test, while boxplots hint that the distributions are not the same. [The two-sample K-S test is not known for excellent power.]

set.seed(2021)
y1 = rgamma(100, 4, .1)
y2 = rnorm(100, 40, 20)
ks.test(y1,y2)$p.val 
[1] 0.05410262

enter image description here

Also, the K-S test had trouble distinguishing between two samples of a thousand observations from a gamma distribution with shape parameter 6 and a normal population with matching means and standard deviations. [Not shown.] A gamma distribution with shape parameter 6 is somewhat less skewed than one with shape parameter 5.

Sometimes graphical displays give clues about important differences that formal tests do not.

Consider the following two samples from different distributions, but with similar means and standard deviations.

set.seed(906)
x1 = rgamma(1000, 4, .1)
mean(x1);  sd(x1)
[1] 39.79927
[1] 19.58579
x2 = rnorm(1000, 40, 20)
mean(x2);  sd(x2)
[1] 39.23941
[1] 19.78541

Boxplots show that the normal sample (top) takes negative values, while the gamma sample does not.

boxplot(x1, x2, col="skyblue2", horizontal=T, pch=20)

enter image description here

In this example a two-sample Kolmogorov-Smirnov test that the two samples are from the same population rejects at the 5% level.

ks.test(x1, x2)

        Two-sample Kolmogorov-Smirnov test

data:  x1 and x2
D = 0.064, p-value = 0.03328
alternative hypothesis: two-sided

Empirical CDF (ECDF) plots look somewhat similar. The K-S statistic $D$ is the maximum vertical distance between the two plots.

plot(ecdf(x1))
lines(ecdf(x2), col="blue")

enter image description here

It is not surprising that a Welch 2-sample t test fails to find a difference between means and that a 2-sample F test fails to find a difference between variances. (There are no differences to be found in either test, and both tests assume both samples are normal.)

t.test(x1, x2)$p.val
[1] 0.5248905
var.test(x1, x2)$p.val
[1] 0.7486433

Moreover, smaller samples from the same two distributions are not detected as different by the K-S test, while boxplots hint that the distributions are not the same. [The two-sample K-S test is not known for excellent power.]

set.seed(2021)
y1 = rgamma(100, 4, .1)
y2 = rnorm(100, 40, 20)
ks.test(y1,y2)$p.val 
[1] 0.05410262

enter image description here

Also, the K-S test had trouble distinguishing between two samples of a thousand observations from a gamma distribution with shape parameter 6 and a normal population with matching means and standard deviations. [Not shown.] A gamma distribution with shape parameter 6 is somewhat less skewed than one with shape parameter 5.

Source Link
BruceET
  • 57.6k
  • 2
  • 36
  • 94

Sometimes graphical displays give clues about important differences that formal tests do not.

Consider the following two samples from different distributions, but with similar means and standard deviations.

set.seed(906)
x1 = rgamma(1000, 4, .1)
mean(x1);  sd(x1)
[1] 39.79927
[1] 19.58579
x2 = rnorm(1000, 40, 20)
mean(x2);  sd(x2)
[1] 39.23941
[1] 19.78541

Boxplots show that one sample takes negative values, while the other does not.

boxplot(x1, x2, col="skyblue2", horizontal=T, pch=20)

enter image description here

In this example a two-sample Kolmogorov-Smirnov test that the two samples are from the same population rejects at the 5% level.

ks.test(x1, x2)

        Two-sample Kolmogorov-Smirnov test

data:  x1 and x2
D = 0.064, p-value = 0.03328
alternative hypothesis: two-sided

Empirical CDF (ECDF) plots look similar. The K-S statistic $D$ is the maximum vertical distance between the two plots.

plot(ecdf(x1))
lines(ecdf(x2), col="blue")

enter image description here

It is not surprising that a Welch 2-sample t test fails to find a difference between means and that a 2-sample F test fails to find a difference between variances. (There are no differences to be found in either test, and both tests assume both samples are normal.)

t.test(x1, x2)$p.val
[1] 0.5248905
var.test(x1, x2)$p.val
[1] 0.7486433

Moreover, smaller samples from the same two distributions are not detected as different by the K-S test, while boxplots hint that the distributions are not the same. [The two-sample K-S test is not known for excellent power.]

set.seed(2021)
y1 = rgamma(100, 4, .1)
y2 = rnorm(100, 40, 20)
ks.test(y1,y2)$p.val 
[1] 0.05410262

enter image description here

Also, the K-S test had trouble distinguishing between two samples of a thousand observations from a gamma distribution with shape parameter 6 and a normal population with matching means and standard deviations. [Not shown.] A gamma distribution with shape parameter 6 is somewhat less skewed than one with shape parameter 5.