Bounty Ended with 100 reputation awarded by Parseltongue
added 2089 characters in body
Source Link
Sextus Empiricus
  • 86.6k
  • 6
  • 115
  • 304

Plotting

Purely as an initial explanatory investigation I would use some plots of effect-size vs moderator.

Using clustering or other reduction of dimensionality

Potentially you might perform some cluster analysis on your population based on the other variables. Then after classifying your users into groups, or by expressing the group membership with some lda or pca score. With the reduction of the number of dimensions, you can see if there is a correlation between the group membership class or group membership score and the effect size.

Example

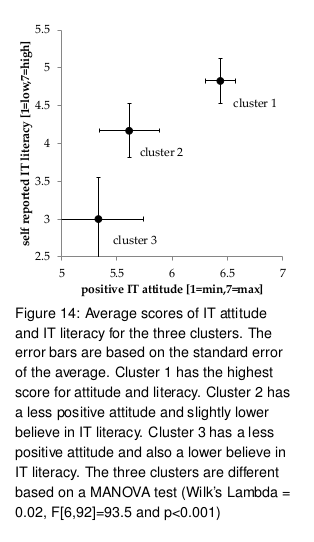
Below is an example of a little research performed while writing some software tools. The goal was to make a description of the user group, to find out how they differ regarding IT literacy and IT attitude and to see which attributes they find most important.

These two parameters where determined in a survey along with a bunch of other questions about the importance of different attributes.

The initial idea was actually to determine the importance of different attributes as a function of the IT literacy and IT attitude. E.g. people with more/less IT literacy/attitude are gonna find different attributes more/less important.

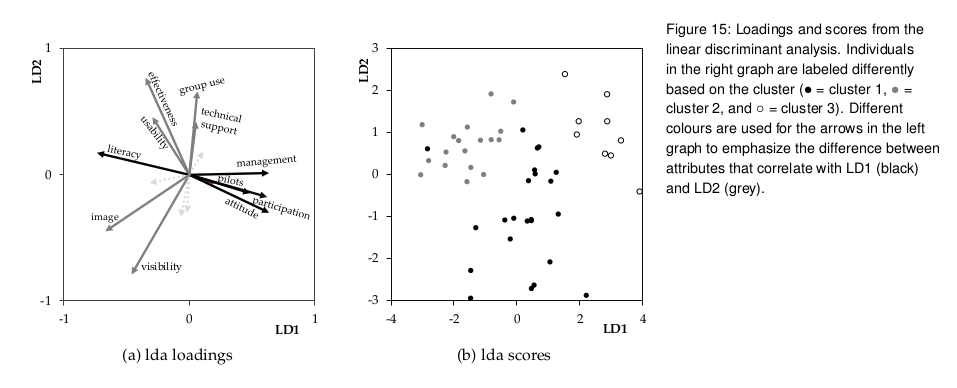
But it was turned around and the outcome of the dependent variables was seen to be clustered.

clustering

Then based on these different clusters we can see how the "independent"/explanatory variable* is different for these clusters.

relation of clusters with independent variable

In your case:

  • Try and cluster variables. Or reduce dimensionality.

  • Instead of looking how the DV/effect differs as function of your potential moderators, you can try and see how the moderators differ as function of the DV/effect.

    The heterogeneity might occur because only a few people, with some property, will have some high effect size.

    • In this case, you could see this clearly by observing that people with a high effect size often have some properties of moderators.
    • But the other way around might not be so clear. When you look at the properties and see if the effect size differs, then it might be not significant if only a few have a high effect size or if the effect size has a large spread.

*I write independent in quotes, because the variable is not really independent or controlled. It is a random variable. But I consider it as the explanatory variables. The attitudes are considered to be caused by the explanatory ("independent") variables.

Purely as an initial explanatory investigation I would use some plots of effect-size vs moderator.

Potentially you might perform some cluster analysis on your population based on the other variables. Then after classifying your users into groups, or by expressing the group membership with some lda or pca score. With the reduction of the number of dimensions, you can see if there is a correlation between the group membership class or group membership score and the effect size.

Plotting

Purely as an initial explanatory investigation I would use some plots of effect-size vs moderator.

Using clustering or other reduction of dimensionality

Potentially you might perform some cluster analysis on your population based on the other variables. Then after classifying your users into groups, or by expressing the group membership with some lda or pca score. With the reduction of the number of dimensions, you can see if there is a correlation between the group membership class or group membership score and the effect size.

Example

Below is an example of a little research performed while writing some software tools. The goal was to make a description of the user group, to find out how they differ regarding IT literacy and IT attitude and to see which attributes they find most important.

These two parameters where determined in a survey along with a bunch of other questions about the importance of different attributes.

The initial idea was actually to determine the importance of different attributes as a function of the IT literacy and IT attitude. E.g. people with more/less IT literacy/attitude are gonna find different attributes more/less important.

But it was turned around and the outcome of the dependent variables was seen to be clustered.

clustering

Then based on these different clusters we can see how the "independent"/explanatory variable* is different for these clusters.

relation of clusters with independent variable

In your case:

  • Try and cluster variables. Or reduce dimensionality.

  • Instead of looking how the DV/effect differs as function of your potential moderators, you can try and see how the moderators differ as function of the DV/effect.

    The heterogeneity might occur because only a few people, with some property, will have some high effect size.

    • In this case, you could see this clearly by observing that people with a high effect size often have some properties of moderators.
    • But the other way around might not be so clear. When you look at the properties and see if the effect size differs, then it might be not significant if only a few have a high effect size or if the effect size has a large spread.

*I write independent in quotes, because the variable is not really independent or controlled. It is a random variable. But I consider it as the explanatory variables. The attitudes are considered to be caused by the explanatory ("independent") variables.
Source Link
Sextus Empiricus
  • 86.6k
  • 6
  • 115
  • 304

Purely as an initial explanatory investigation I would use some plots of effect-size vs moderator.

Potentially you might perform some cluster analysis on your population based on the other variables. Then after classifying your users into groups, or by expressing the group membership with some lda or pca score. With the reduction of the number of dimensions, you can see if there is a correlation between the group membership class or group membership score and the effect size.