Bumped by Community user
edited tags; edited tags
Link
Stephan Kolassa
  • 130.8k
  • 22
  • 264
  • 497
added 9 characters in body
Source Link

Using the excellent forecast package by Rob Hyndman, I came across the need to not only have prediction intervals, but to simulate a number of future paths, given past observations of a time series with complex seasonalities. There is something for less complex time series with one or two seasonalities only (simulate.ets() in the forecast package), but in my case, I would require the equivalent of simulate.ets() for the more complex tbats model.

I assume that the data necessary for creating such paths is already present in the fit object, yet the possibility to create sample paths seems to be not directly accessible. Therefore, I have come up with a naive solution and would like to know, whether this approach is correct.

require(forecast)
fit = bats(test,use.parallel=T,use.damped.trend=F,use.trend=T,seasonal.periods=seasonal.periods)

Naively, I imagine that sample paths can be constructed by using the point forecast from

fit 

> forecast(fit)
         Point Forecast    Lo 80    Hi 80    Lo 95    Hi 95
1960.016       24.48576 23.82518 25.14633 23.47550 25.49602
1960.032       24.79870 23.88004 25.71735 23.39374 26.20366
1960.048       25.31743 24.39878 26.23608 23.91247 26.72239
1960.065       25.69254 24.77389 26.61120 24.28759 27.09750 
1960.081       26.06863 25.14998 26.98729 24.66367 27.47359
1960.097       26.43215 25.51350 27.35080 25.02719 27.83711
1960.113       26.77674 25.85809 27.69540 25.37179 28.18170

and simply adding randomly drawn values from the model fitting procedure.

> fit$errors
Time Series:
Start = c(1959, 2) 
End = c(1960, 1) 
Frequency = 365 
  [1]  0.140656913 -0.455335141 -0.558989185  1.697532911 -0.114406022  0.366182718 -0.377056927  0.396144296

Therfore, with

prediction = forecast(fit)
errors = fit$errors

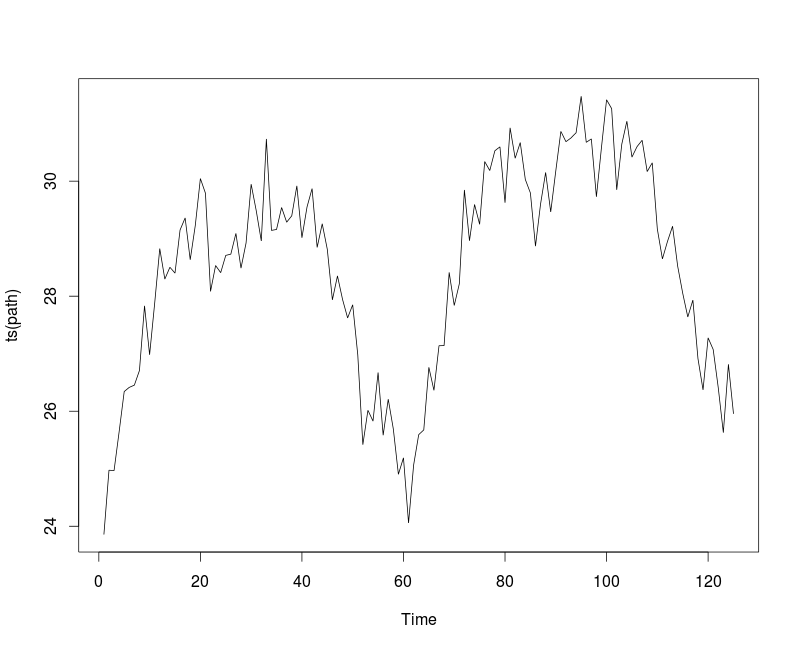
path = prediction$mean + sample(errors, size = length(prediction$mean))
plot(ts(path))

one sample path can be constructed.   

https://i.sstatic.net/mO83W.pngenter image description here
Is this a valid way of constructing sample paths? If not, what would be a correct way?

Thanks a lot for any help!

Using the excellent forecast package by Rob Hyndman, I came across the need to not only have prediction intervals, but to simulate a number of future paths, given past observations of a time series with complex seasonalities. There is something for less complex time series with one or two seasonalities only (simulate.ets() in the forecast package), but in my case, I would require the equivalent of simulate.ets() for the more complex tbats model.

I assume that the data necessary for creating such paths is already present in the fit object, yet the possibility to create sample paths seems to be not directly accessible. Therefore, I have come up with a naive solution and would like to know, whether this approach is correct.

require(forecast)
fit = bats(test,use.parallel=T,use.damped.trend=F,use.trend=T,seasonal.periods=seasonal.periods)

Naively, I imagine that sample paths can be constructed by using the point forecast from

fit 

> forecast(fit)
         Point Forecast    Lo 80    Hi 80    Lo 95    Hi 95
1960.016       24.48576 23.82518 25.14633 23.47550 25.49602
1960.032       24.79870 23.88004 25.71735 23.39374 26.20366
1960.048       25.31743 24.39878 26.23608 23.91247 26.72239
1960.065       25.69254 24.77389 26.61120 24.28759 27.09750 
1960.081       26.06863 25.14998 26.98729 24.66367 27.47359
1960.097       26.43215 25.51350 27.35080 25.02719 27.83711
1960.113       26.77674 25.85809 27.69540 25.37179 28.18170

and simply adding randomly drawn values from the model fitting procedure.

> fit$errors
Time Series:
Start = c(1959, 2) 
End = c(1960, 1) 
Frequency = 365 
  [1]  0.140656913 -0.455335141 -0.558989185  1.697532911 -0.114406022  0.366182718 -0.377056927  0.396144296

Therfore, with

prediction = forecast(fit)
errors = fit$errors

path = prediction$mean + sample(errors, size = length(prediction$mean))
plot(ts(path))

one sample path can be constructed.  https://i.sstatic.net/mO83W.png

Is this a valid way of constructing sample paths? If not, what would be a correct way?

Thanks a lot for any help!

Using the excellent forecast package by Rob Hyndman, I came across the need to not only have prediction intervals, but to simulate a number of future paths, given past observations of a time series with complex seasonalities. There is something for less complex time series with one or two seasonalities only (simulate.ets() in the forecast package), but in my case, I would require the equivalent of simulate.ets() for the more complex tbats model.

I assume that the data necessary for creating such paths is already present in the fit object, yet the possibility to create sample paths seems to be not directly accessible. Therefore, I have come up with a naive solution and would like to know, whether this approach is correct.

require(forecast)
fit = bats(test,use.parallel=T,use.damped.trend=F,use.trend=T,seasonal.periods=seasonal.periods)

Naively, I imagine that sample paths can be constructed by using the point forecast from

fit 

> forecast(fit)
         Point Forecast    Lo 80    Hi 80    Lo 95    Hi 95
1960.016       24.48576 23.82518 25.14633 23.47550 25.49602
1960.032       24.79870 23.88004 25.71735 23.39374 26.20366
1960.048       25.31743 24.39878 26.23608 23.91247 26.72239
1960.065       25.69254 24.77389 26.61120 24.28759 27.09750 
1960.081       26.06863 25.14998 26.98729 24.66367 27.47359
1960.097       26.43215 25.51350 27.35080 25.02719 27.83711
1960.113       26.77674 25.85809 27.69540 25.37179 28.18170

and simply adding randomly drawn values from the model fitting procedure.

> fit$errors
Time Series:
Start = c(1959, 2) 
End = c(1960, 1) 
Frequency = 365 
  [1]  0.140656913 -0.455335141 -0.558989185  1.697532911 -0.114406022  0.366182718 -0.377056927  0.396144296

Therfore, with

prediction = forecast(fit)
errors = fit$errors

path = prediction$mean + sample(errors, size = length(prediction$mean))
plot(ts(path))

one sample path can be constructed. 

enter image description here

Is this a valid way of constructing sample paths? If not, what would be a correct way?

Thanks a lot for any help!

Tweeted twitter.com/StackStats/status/730681123081207808
Source Link

Simulate forecast sample paths from tbats model

Using the excellent forecast package by Rob Hyndman, I came across the need to not only have prediction intervals, but to simulate a number of future paths, given past observations of a time series with complex seasonalities. There is something for less complex time series with one or two seasonalities only (simulate.ets() in the forecast package), but in my case, I would require the equivalent of simulate.ets() for the more complex tbats model.

I assume that the data necessary for creating such paths is already present in the fit object, yet the possibility to create sample paths seems to be not directly accessible. Therefore, I have come up with a naive solution and would like to know, whether this approach is correct.

require(forecast)
fit = bats(test,use.parallel=T,use.damped.trend=F,use.trend=T,seasonal.periods=seasonal.periods)

Naively, I imagine that sample paths can be constructed by using the point forecast from

fit 

> forecast(fit)
         Point Forecast    Lo 80    Hi 80    Lo 95    Hi 95
1960.016       24.48576 23.82518 25.14633 23.47550 25.49602
1960.032       24.79870 23.88004 25.71735 23.39374 26.20366
1960.048       25.31743 24.39878 26.23608 23.91247 26.72239
1960.065       25.69254 24.77389 26.61120 24.28759 27.09750 
1960.081       26.06863 25.14998 26.98729 24.66367 27.47359
1960.097       26.43215 25.51350 27.35080 25.02719 27.83711
1960.113       26.77674 25.85809 27.69540 25.37179 28.18170

and simply adding randomly drawn values from the model fitting procedure.

> fit$errors
Time Series:
Start = c(1959, 2) 
End = c(1960, 1) 
Frequency = 365 
  [1]  0.140656913 -0.455335141 -0.558989185  1.697532911 -0.114406022  0.366182718 -0.377056927  0.396144296

Therfore, with

prediction = forecast(fit)
errors = fit$errors

path = prediction$mean + sample(errors, size = length(prediction$mean))
plot(ts(path))

one sample path can be constructed. https://i.sstatic.net/mO83W.png

Is this a valid way of constructing sample paths? If not, what would be a correct way?

Thanks a lot for any help!