added 337 characters in body
Source Link
Sextus Empiricus
  • 86.4k
  • 6
  • 115
  • 301

In short: 1 Roughly speaking you can see the distribution of $O_i - E_i$ as independent from the distribution of $E_i$. So if $E_i$ is a lot different from the true value does not matter so much for $O_i - E_i$. 2 The role of the $E_i$ in the denominator will be small if the observed numbers are sufficiently high.


Lets for simplicity consider the case where we only have 2 categories

$$\begin{array}{c|cc} & \text{category 1} & \text{category 2} \\ \hline \text{variable 1} &O_{11} & O_{12} \\ \text{variable 2}& O_{21} & O_{22} \\ \end{array} $$

and we fix the number of observations to $n$. Then due to the dependency we have basically only two observations. This simplifies the case because we can view it 2d and plot it.

$$\begin{array}{c|cc} & \text{category 1} & \text{category 2} \\ \hline \text{variable 1} &x & n-x \\ \text{variable 2}& y & n-y \\ \end{array}$$

Let's consider $n = 100$ and the hypothetical true categorical distribution has a fifty-fifty distribution for both categories.

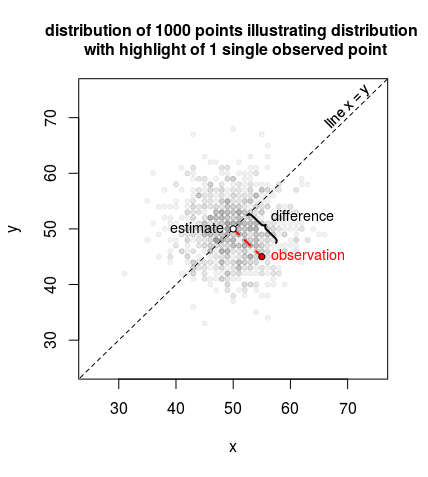
Then $x$ and $y$ (and the related $O_{ij}$) will be binomially distributed, but they can also be approximated as a normal distribution. Below a distribution is sketched by showing a sample of 1000 points

example

In the image, we also show how we can intuitively view the computation of the $\chi^2$ statistic. It can be based on the residual vector of the model which projects the observation $x,y$ onto the point $\beta,\beta$, on the diagonal line (with $\beta = (x+y)/2$). Where the length of this line is

$$d = \sqrt{\left( x-\beta \right)^2 + \left( y-\beta \right)^2 }$$

and $\beta$ is

$$\beta = \frac{x+y}{2}$$

We can relate this $\beta$ and $d$ to the following

  • approximately normal and independent distributed variables with

    $$\begin{array}{} d & \sim & N(\mu = 0,&\sigma^2 = 0.5 n) \\ \beta & \sim & N(\mu = n/2,& \sigma^2 = 0.5 n) \end{array}$$

  • the $\chi^2$ statistics equal to:

    $$\begin{array}{} \chi^2 &=& \frac{(O_{11}-E_{11})^2}{E_{11}} + \frac{(O_{12}-E_{12})^2}{E_{12}} + \frac{(O_{21}-E_{21})^2}{E_{21}} + \frac{(O_{22}-E_{22})^2}{E_{22}} \\ &=& \frac{(x-\beta)^2}{\beta} + \frac{(y-\beta)^2}{n-\beta} + \frac{(x-\beta)^2}{\beta} + \frac{(y-\beta)^2}{n-\beta} \\ &=& \frac{\frac{1}{2} d^2}{\beta} + \frac{\frac{1}{2} d^2}{n-\beta} + \frac{\frac{1}{2} d^2}{\beta} + \frac{\frac{1}{2} d^2}{n-\beta} \qquad \text{using $\beta^\prime = \beta-0.5n$} \\ &= &\frac{d^2}{(0.5n-\beta^\prime)(0.5n+\beta^\prime)} \\ & \approx& \frac{d^2}{(0.5 n)^2} \end{array}$$

What if $E_i$ happens to be far from the true expected value?

So in the view of the $\chi^2$ statistic approaching the chi-squared distribution as the above-explained approximation we see the influence of $E_i$ disappear in two points.

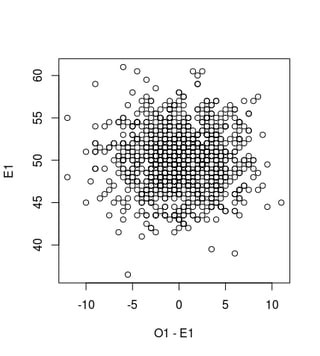
  1. The error terms in the numerator $(O_i - E_i)^2$ are like the residuals, and independently$^1$ distributed from the estimate $E_i$.
  2. The expression of $E_i$ in the denominator has only a very small influence if the numbers are high. The numbers $E_i$ may already have a small coefficient of determination (if the numbers are high), but also the increase of one $E_i$ is paired with the decrease of another $E_i$, and this dampens the effect on the chi-squared statistic even more.

1) an example/illustration of this independence is made with the following image and R-code

independence

set.seed(1)
O1 = rbinom(n,100,0.5)
O2 = rbinom(n,100,0.5)
E1 = 0.5*(O1+O2)
plot(O1-E1, E1)
In short: 1 Roughly speaking you can see the distribution of $O_i - E_i$ as independent from the distribution of $E_i$. So if $E_i$ is a lot different from the true value does not matter so much for $O_i - E_i$. 2 The role of the $E_i$ in the denominator will be small if the observed numbers are sufficiently high.


Lets for simplicity consider the case where we only have 2 categories

$$\begin{array}{c|cc} & \text{category 1} & \text{category 2} \\ \hline \text{variable 1} &O_{11} & O_{12} \\ \text{variable 2}& O_{21} & O_{22} \\ \end{array} $$

and we fix the number of observations to $n$. Then due to the dependency we have basically only two observations. This simplifies the case because we can view it 2d and plot it.

$$\begin{array}{c|cc} & \text{category 1} & \text{category 2} \\ \hline \text{variable 1} &x & n-x \\ \text{variable 2}& y & n-y \\ \end{array}$$

Let's consider $n = 100$ and the hypothetical true categorical distribution has a fifty-fifty distribution for both categories.

Then $x$ and $y$ (and the related $O_{ij}$) will be binomially distributed, but they can also be approximated as a normal distribution. Below a distribution is sketched by showing a sample of 1000 points

example

In the image, we also show how we can intuitively view the computation of the $\chi^2$ statistic. It can be based on the residual vector of the model which projects the observation $x,y$ onto the point $\beta,\beta$, on the diagonal line (with $\beta = (x+y)/2$). Where the length of this line is

$$d = \sqrt{\left( x-\beta \right)^2 + \left( y-\beta \right)^2 }$$

and $\beta$ is

$$\beta = \frac{x+y}{2}$$

We can relate this $\beta$ and $d$ to the following

  • approximately normal and independent distributed variables with

    $$\begin{array}{} d & \sim & N(\mu = 0,&\sigma^2 = 0.5 n) \\ \beta & \sim & N(\mu = n/2,& \sigma^2 = 0.5 n) \end{array}$$

  • the $\chi^2$ statistics equal to:

    $$\begin{array}{} \chi^2 &=& \frac{(O_{11}-E_{11})^2}{E_{11}} + \frac{(O_{12}-E_{12})^2}{E_{12}} + \frac{(O_{21}-E_{21})^2}{E_{21}} + \frac{(O_{22}-E_{22})^2}{E_{22}} \\ &=& \frac{(x-\beta)^2}{\beta} + \frac{(y-\beta)^2}{n-\beta} + \frac{(x-\beta)^2}{\beta} + \frac{(y-\beta)^2}{n-\beta} \\ &=& \frac{\frac{1}{2} d^2}{\beta} + \frac{\frac{1}{2} d^2}{n-\beta} + \frac{\frac{1}{2} d^2}{\beta} + \frac{\frac{1}{2} d^2}{n-\beta} \qquad \text{using $\beta^\prime = \beta-0.5n$} \\ &= &\frac{d^2}{(0.5n-\beta^\prime)(0.5n+\beta^\prime)} \\ & \approx& \frac{d^2}{(0.5 n)^2} \end{array}$$

What if $E_i$ happens to be far from the true expected value?

So in the view of the $\chi^2$ statistic approaching the chi-squared distribution as the above-explained approximation we see the influence of $E_i$ disappear in two points.

  1. The error terms in the numerator $(O_i - E_i)^2$ are like the residuals, and independently$^1$ distributed from the estimate $E_i$.
  2. The expression of $E_i$ in the denominator has only a very small influence if the numbers are high. The numbers $E_i$ may already have a small coefficient of determination (if the numbers are high), but also the increase of one $E_i$ is paired with the decrease of another $E_i$, and this dampens the effect on the chi-squared statistic even more.

1) an example/illustration of this independence is made with the following image and R-code

independence

set.seed(1)
O1 = rbinom(n,100,0.5)
O2 = rbinom(n,100,0.5)
E1 = 0.5*(O1+O2)
plot(O1-E1, E1)
deleted 10 characters in body
Source Link
Sextus Empiricus
  • 86.4k
  • 6
  • 115
  • 301

Lets for simplicity consider the case where we only have 2 categories

$$\begin{array}{c|cc} & \text{category 1} & \text{category 2} \\ \hline \text{variable 1} &O_{11} & O_{12} \\ \text{variable 2}& O_{21} & O_{22} \\ \end{array} $$

and we fix the number of observations to $n$. Then due to the dependency we have basically only two observations. This simplifies the case because we can view it 2d and plot it.

$$\begin{array}{c|cc} & \text{category 1} & \text{category 2} \\ \hline \text{variable 1} &x & n-x \\ \text{variable 2}& y & n-y \\ \end{array}$$

Let's consider $n = 100$ and the hypothetical true categorical distribution has a fifty-fifty distribution for both categories.

Then $x$ and $y$ (and the related $O_{ij}$) will be binomially distributed, but they can also be approximated as a normal distribution. Below a distribution is sketched by showing a sample of 1000 points

example

In the image, we also show how we can intuitively view the computation of the $\chi^2$ statistic. It can be based on the residual vector of the model which projects the observation $x,y$ onto the point $\beta,\beta$, on the diagonal line (with $\beta = (x+y)/2$). Where the length of this line is

$$d = \sqrt{\left( x-\beta \right)^2 + \left( y-\beta \right)^2 }$$

and $\beta$ is

$$\beta = \frac{x+y}{2}$$

We can relate this $\beta$ and $d$ to the following

  • approximately normal and independent distributed variables with

    $$\begin{array}{} d & \sim & N(\mu = 0,&\sigma^2 = 0.5 n) \\ \beta & \sim & N(\mu = n/2,& \sigma^2 = 0.5 n) \end{array}$$

  • the $\chi^2$ statistics equal to:

    $$\begin{array}{} \chi^2 &=& \frac{(O_{11}-E_{11})^2}{E_{11}} + \frac{(O_{12}-E_{12})^2}{E_{12}} + \frac{(O_{21}-E_{21})^2}{E_{21}} + \frac{(O_{22}-E_{22})^2}{E_{22}} \\ &=& \frac{(x-\beta)^2}{\beta} + \frac{(y-\beta)^2}{n-\beta} + \frac{(x-\beta)^2}{\beta} + \frac{(y-\beta)^2}{n-\beta} \\ &=& \frac{\frac{1}{2} d^2}{\beta} + \frac{\frac{1}{2} d^2}{n-\beta} + \frac{\frac{1}{2} d^2}{\beta} + \frac{\frac{1}{2} d^2}{n-\beta} \\ \\ &= &\frac{d^2}{(0.5n-\beta^\prime)(0.5n+\beta^\prime)} \\ & \approx& \frac{d^2}{(0.5 n)^2} \end{array}$$ where in the end we used $\beta^\prime = \beta-0.5n$$$\begin{array}{} \chi^2 &=& \frac{(O_{11}-E_{11})^2}{E_{11}} + \frac{(O_{12}-E_{12})^2}{E_{12}} + \frac{(O_{21}-E_{21})^2}{E_{21}} + \frac{(O_{22}-E_{22})^2}{E_{22}} \\ &=& \frac{(x-\beta)^2}{\beta} + \frac{(y-\beta)^2}{n-\beta} + \frac{(x-\beta)^2}{\beta} + \frac{(y-\beta)^2}{n-\beta} \\ &=& \frac{\frac{1}{2} d^2}{\beta} + \frac{\frac{1}{2} d^2}{n-\beta} + \frac{\frac{1}{2} d^2}{\beta} + \frac{\frac{1}{2} d^2}{n-\beta} \qquad \text{using $\beta^\prime = \beta-0.5n$} \\ &= &\frac{d^2}{(0.5n-\beta^\prime)(0.5n+\beta^\prime)} \\ & \approx& \frac{d^2}{(0.5 n)^2} \end{array}$$

What if $E_i$ happens to be far from the true expected value?

So in the view of the $\chi^2$ statistic approaching the chi-squared distribution as the above-explained approximation we see the influence of $E_i$ disappear in two points.

  1. The error terms in the numerator $(O_i - E_i)^2$ are like the residuals, and independently$^1$ distributed from the estimate $E_i$.
  2. The expression of $E_i$ in the denominator has only a very small influence if the numbers are high. The numbers $E_i$ vary onlymay already have a littlesmall coefficient of determination (if the numbers are high), but also the increase of one $E_i$ is paired with the decrease of another $E_i$, and this dampens the effect on the chi-squared statistic even more.

1) an example/illustration of this independence is made with the following image and R-code

independence

set.seed(1)
O1 = rbinom(n,100,0.5)
O2 = rbinom(n,100,0.5)
E1 = 0.5*(O1+O2)
plot(O1-E1, E1)

Lets for simplicity consider the case where we only have 2 categories

$$\begin{array}{c|cc} & \text{category 1} & \text{category 2} \\ \hline \text{variable 1} &O_{11} & O_{12} \\ \text{variable 2}& O_{21} & O_{22} \\ \end{array} $$

and we fix the number of observations to $n$. Then due to the dependency we have basically only two observations. This simplifies the case because we can view it 2d and plot it.

$$\begin{array}{c|cc} & \text{category 1} & \text{category 2} \\ \hline \text{variable 1} &x & n-x \\ \text{variable 2}& y & n-y \\ \end{array}$$

Let's consider $n = 100$ and the hypothetical true categorical distribution has a fifty-fifty distribution for both categories.

Then $x$ and $y$ (and the related $O_{ij}$) will be binomially distributed, but they can also be approximated as a normal distribution. Below a distribution is sketched by showing a sample of 1000 points

example

In the image, we also show how we can intuitively view the computation of the $\chi^2$ statistic. It can be based on the residual vector of the model which projects the observation $x,y$ onto the point $\beta,\beta$, on the diagonal line (with $\beta = (x+y)/2$). Where the length of this line is

$$d = \sqrt{\left( x-\beta \right)^2 + \left( y-\beta \right)^2 }$$

and $\beta$ is

$$\beta = \frac{x+y}{2}$$

We can relate this $\beta$ and $d$ to the following

  • approximately normal and independent distributed variables with

    $$\begin{array}{} d & \sim & N(\mu = 0,&\sigma^2 = 0.5 n) \\ \beta & \sim & N(\mu = n/2,& \sigma^2 = 0.5 n) \end{array}$$

  • the $\chi^2$ statistics equal to:

    $$\begin{array}{} \chi^2 &=& \frac{(O_{11}-E_{11})^2}{E_{11}} + \frac{(O_{12}-E_{12})^2}{E_{12}} + \frac{(O_{21}-E_{21})^2}{E_{21}} + \frac{(O_{22}-E_{22})^2}{E_{22}} \\ &=& \frac{(x-\beta)^2}{\beta} + \frac{(y-\beta)^2}{n-\beta} + \frac{(x-\beta)^2}{\beta} + \frac{(y-\beta)^2}{n-\beta} \\ &=& \frac{\frac{1}{2} d^2}{\beta} + \frac{\frac{1}{2} d^2}{n-\beta} + \frac{\frac{1}{2} d^2}{\beta} + \frac{\frac{1}{2} d^2}{n-\beta} \\ \\ &= &\frac{d^2}{(0.5n-\beta^\prime)(0.5n+\beta^\prime)} \\ & \approx& \frac{d^2}{(0.5 n)^2} \end{array}$$ where in the end we used $\beta^\prime = \beta-0.5n$

What if $E_i$ happens to be far from the true expected value?

So in the view of the $\chi^2$ statistic approaching the chi-squared distribution as the above-explained approximation we see the influence of $E_i$ disappear in two points.

  1. The error terms in the numerator $(O_i - E_i)^2$ are like the residuals, and independently$^1$ distributed from the estimate $E_i$.
  2. The expression of $E_i$ in the denominator has only a very small influence if the numbers are high. The numbers $E_i$ vary only a little, but also the increase of one $E_i$ is paired with the decrease of another $E_i$, and this dampens the effect on the chi-squared statistic.

1) an example/illustration of this independence is made with the following image and R-code

independence

set.seed(1)
O1 = rbinom(n,100,0.5)
O2 = rbinom(n,100,0.5)
E1 = 0.5*(O1+O2)
plot(O1-E1, E1)

Lets for simplicity consider the case where we only have 2 categories

$$\begin{array}{c|cc} & \text{category 1} & \text{category 2} \\ \hline \text{variable 1} &O_{11} & O_{12} \\ \text{variable 2}& O_{21} & O_{22} \\ \end{array} $$

and we fix the number of observations to $n$. Then due to the dependency we have basically only two observations. This simplifies the case because we can view it 2d and plot it.

$$\begin{array}{c|cc} & \text{category 1} & \text{category 2} \\ \hline \text{variable 1} &x & n-x \\ \text{variable 2}& y & n-y \\ \end{array}$$

Let's consider $n = 100$ and the hypothetical true categorical distribution has a fifty-fifty distribution for both categories.

Then $x$ and $y$ (and the related $O_{ij}$) will be binomially distributed, but they can also be approximated as a normal distribution. Below a distribution is sketched by showing a sample of 1000 points

example

In the image, we also show how we can intuitively view the computation of the $\chi^2$ statistic. It can be based on the residual vector of the model which projects the observation $x,y$ onto the point $\beta,\beta$, on the diagonal line (with $\beta = (x+y)/2$). Where the length of this line is

$$d = \sqrt{\left( x-\beta \right)^2 + \left( y-\beta \right)^2 }$$

and $\beta$ is

$$\beta = \frac{x+y}{2}$$

We can relate this $\beta$ and $d$ to the following

  • approximately normal and independent distributed variables with

    $$\begin{array}{} d & \sim & N(\mu = 0,&\sigma^2 = 0.5 n) \\ \beta & \sim & N(\mu = n/2,& \sigma^2 = 0.5 n) \end{array}$$

  • the $\chi^2$ statistics equal to:

    $$\begin{array}{} \chi^2 &=& \frac{(O_{11}-E_{11})^2}{E_{11}} + \frac{(O_{12}-E_{12})^2}{E_{12}} + \frac{(O_{21}-E_{21})^2}{E_{21}} + \frac{(O_{22}-E_{22})^2}{E_{22}} \\ &=& \frac{(x-\beta)^2}{\beta} + \frac{(y-\beta)^2}{n-\beta} + \frac{(x-\beta)^2}{\beta} + \frac{(y-\beta)^2}{n-\beta} \\ &=& \frac{\frac{1}{2} d^2}{\beta} + \frac{\frac{1}{2} d^2}{n-\beta} + \frac{\frac{1}{2} d^2}{\beta} + \frac{\frac{1}{2} d^2}{n-\beta} \qquad \text{using $\beta^\prime = \beta-0.5n$} \\ &= &\frac{d^2}{(0.5n-\beta^\prime)(0.5n+\beta^\prime)} \\ & \approx& \frac{d^2}{(0.5 n)^2} \end{array}$$

What if $E_i$ happens to be far from the true expected value?

So in the view of the $\chi^2$ statistic approaching the chi-squared distribution as the above-explained approximation we see the influence of $E_i$ disappear in two points.

  1. The error terms in the numerator $(O_i - E_i)^2$ are like the residuals, and independently$^1$ distributed from the estimate $E_i$.
  2. The expression of $E_i$ in the denominator has only a very small influence if the numbers are high. The numbers $E_i$ may already have a small coefficient of determination (if the numbers are high), but also the increase of one $E_i$ is paired with the decrease of another $E_i$, and this dampens the effect on the chi-squared statistic even more.

1) an example/illustration of this independence is made with the following image and R-code

independence

set.seed(1)
O1 = rbinom(n,100,0.5)
O2 = rbinom(n,100,0.5)
E1 = 0.5*(O1+O2)
plot(O1-E1, E1)
added 315 characters in body
Source Link
Sextus Empiricus
  • 86.4k
  • 6
  • 115
  • 301

Lets for simplicity consider the case where we only have 2 categories

$$\begin{array}{c|cc} & \text{category 1} & \text{category 2} \\ \hline \text{variable 1} &O_{11} & O_{12} \\ \text{variable 2}& O_{21} & O_{22} \\ \end{array} $$

and we fix the number of observations to $n$. Then due to the dependency we have basically only two observations. This simplifies the case because we can view it 2d and plot it.

$$\begin{array}{c|cc} & \text{category 1} & \text{category 2} \\ \hline \text{variable 1} &x & n-x \\ \text{variable 2}& y & n-y \\ \end{array}$$

Let's consider $n = 100$ and the hypothetical true categorical distribution has a fifty-fifty distribution for both categories.

Then $x$ and $y$ (and the related $O_{ij}$) will be binomially distributed, but they can also be approximated as a normal distribution. Below a distribution is sketched by showing a sample of 1000 points

example

In the image, we also show how we can intuitively view the computation of the $\chi^2$ statistic. It can be based on the residual vector of the model which projects the observation $x,y$ onto the point $\beta,\beta$, on the diagonal line (with $\beta = (x+y)/2$). Where the length of this line is

$$d = \sqrt{\left( x-\beta \right)^2 + \left( y-\beta \right)^2 }$$

and $\beta$ is

$$\beta = \frac{x+y}{2}$$

We can relate this $\beta$ and $d$ to the following

  • approximately normal and independent distributed variables with

    $$\begin{array}{} d & \sim & N(\mu = 0,&\sigma^2 = 0.5 n) \\ \beta & \sim & N(\mu = n/2,& \sigma^2 = 0.5 n) \end{array}$$

  • the $\chi^2$ statistics equal to:

    $$\begin{array}{} \chi^2 &=& \frac{(O_{11}-E_{11})^2}{E_{11}} + \frac{(O_{12}-E_{12})^2}{E_{12}} + \frac{(O_{21}-E_{21})^2}{E_{21}} + \frac{(O_{22}-E_{22})^2}{E_{22}} \\ &=& \frac{(x-\beta)^2}{\beta} + \frac{(y-\beta)^2}{n-\beta} + \frac{(x-\beta)^2}{\beta} + \frac{(y-\beta)^2}{n-\beta} \\ &=& \frac{\frac{1}{2} d^2}{\beta} + \frac{\frac{1}{2} d^2}{n-\beta} + \frac{\frac{1}{2} d^2}{\beta} + \frac{\frac{1}{2} d^2}{n-\beta} \\ \\ &= &\frac{d^2}{(0.5n-\beta^\prime)(0.5n+\beta^\prime)} \\ & \approx& \frac{d^2}{(0.5 n)^2} \end{array}$$ where in the end we used $\beta^\prime = \beta-0.5n$

What if $E_i$ happens to be far from the true expected value?

So in the view of the $\chi^2$ statistic approaching the chi-squared distribution as the above-explained approximation we see the influence of $E_i$ disappear in two points.

  1. The error terms in the numerator $(O_i - E_i)^2$ are like the residuals, and independently$^1$ distributed from the estimate $E_i$.
  2. The expression of $E_i$ in the denominator has only a very small influence if the numbers are high. The numbers $E_i$ vary only a little, but also the increase of one $E_i$ is paired with the decrease of another $E_i$, and this dampens the effect on the chi-squared statistic.

1) an example/illustration of this independence is made with the following image and R-code

independence

set.seed(1)
O1 = rbinom(n,100,0.5)
O2 = rbinom(n,100,0.5)
E1 = 0.5*(O1+O2)
plot(O1-E1, E1)

Lets for simplicity consider the case where we only have 2 categories

$$\begin{array}{c|cc} & \text{category 1} & \text{category 2} \\ \hline \text{variable 1} &O_{11} & O_{12} \\ \text{variable 2}& O_{21} & O_{22} \\ \end{array} $$

and we fix the number of observations to $n$. Then due to the dependency we have basically only two observations. This simplifies the case because we can view it 2d and plot it.

$$\begin{array}{c|cc} & \text{category 1} & \text{category 2} \\ \hline \text{variable 1} &x & n-x \\ \text{variable 2}& y & n-y \\ \end{array}$$

Let's consider $n = 100$ and the hypothetical true categorical distribution has a fifty-fifty distribution for both categories.

Then $x$ and $y$ (and the related $O_{ij}$) will be binomially distributed, but they can also be approximated as a normal distribution. Below a distribution is sketched by showing a sample of 1000 points

example

In the image, we also show how we can intuitively view the computation of the $\chi^2$ statistic. It can be based on the residual vector of the model which projects the observation $x,y$ onto the point $\beta,\beta$, on the diagonal line (with $\beta = (x+y)/2$). Where the length of this line is

$$d = \sqrt{\left( x-\beta \right)^2 + \left( y-\beta \right)^2 }$$

and $\beta$ is

$$\beta = \frac{x+y}{2}$$

We can relate this $\beta$ and $d$ to the following

  • approximately normal and independent distributed variables with

    $$\begin{array}{} d & \sim & N(\mu = 0,&\sigma^2 = 0.5 n) \\ \beta & \sim & N(\mu = n/2,& \sigma^2 = 0.5 n) \end{array}$$

  • the $\chi^2$ statistics equal to:

    $$\begin{array}{} \chi^2 &=& \frac{(O_{11}-E_{11})^2}{E_{11}} + \frac{(O_{12}-E_{12})^2}{E_{12}} + \frac{(O_{21}-E_{21})^2}{E_{21}} + \frac{(O_{22}-E_{22})^2}{E_{22}} \\ &=& \frac{(x-\beta)^2}{\beta} + \frac{(y-\beta)^2}{n-\beta} + \frac{(x-\beta)^2}{\beta} + \frac{(y-\beta)^2}{n-\beta} \\ &=& \frac{\frac{1}{2} d^2}{\beta} + \frac{\frac{1}{2} d^2}{n-\beta} + \frac{\frac{1}{2} d^2}{\beta} + \frac{\frac{1}{2} d^2}{n-\beta} \\ \\ &= &\frac{d^2}{(0.5n-\beta^\prime)(0.5n+\beta^\prime)} \\ & \approx& \frac{d^2}{(0.5 n)^2} \end{array}$$ where in the end we used $\beta^\prime = \beta-0.5n$

What if $E_i$ happens to be far from the true expected value?

So in the view of the $\chi^2$ statistic approaching the chi-squared distribution as the above-explained approximation we see the influence of $E_i$ disappear in two points.

  1. The error terms in the numerator $(O_i - E_i)^2$ are like the residuals, and independently distributed from the estimate $E_i$.
  2. The expression of $E_i$ in the denominator has only a very small influence if the numbers are high. The numbers $E_i$ vary only a little, but also the increase of one $E_i$ is paired with the decrease of another $E_i$, and this dampens the effect on the chi-squared statistic.

Lets for simplicity consider the case where we only have 2 categories

$$\begin{array}{c|cc} & \text{category 1} & \text{category 2} \\ \hline \text{variable 1} &O_{11} & O_{12} \\ \text{variable 2}& O_{21} & O_{22} \\ \end{array} $$

and we fix the number of observations to $n$. Then due to the dependency we have basically only two observations. This simplifies the case because we can view it 2d and plot it.

$$\begin{array}{c|cc} & \text{category 1} & \text{category 2} \\ \hline \text{variable 1} &x & n-x \\ \text{variable 2}& y & n-y \\ \end{array}$$

Let's consider $n = 100$ and the hypothetical true categorical distribution has a fifty-fifty distribution for both categories.

Then $x$ and $y$ (and the related $O_{ij}$) will be binomially distributed, but they can also be approximated as a normal distribution. Below a distribution is sketched by showing a sample of 1000 points

example

In the image, we also show how we can intuitively view the computation of the $\chi^2$ statistic. It can be based on the residual vector of the model which projects the observation $x,y$ onto the point $\beta,\beta$, on the diagonal line (with $\beta = (x+y)/2$). Where the length of this line is

$$d = \sqrt{\left( x-\beta \right)^2 + \left( y-\beta \right)^2 }$$

and $\beta$ is

$$\beta = \frac{x+y}{2}$$

We can relate this $\beta$ and $d$ to the following

  • approximately normal and independent distributed variables with

    $$\begin{array}{} d & \sim & N(\mu = 0,&\sigma^2 = 0.5 n) \\ \beta & \sim & N(\mu = n/2,& \sigma^2 = 0.5 n) \end{array}$$

  • the $\chi^2$ statistics equal to:

    $$\begin{array}{} \chi^2 &=& \frac{(O_{11}-E_{11})^2}{E_{11}} + \frac{(O_{12}-E_{12})^2}{E_{12}} + \frac{(O_{21}-E_{21})^2}{E_{21}} + \frac{(O_{22}-E_{22})^2}{E_{22}} \\ &=& \frac{(x-\beta)^2}{\beta} + \frac{(y-\beta)^2}{n-\beta} + \frac{(x-\beta)^2}{\beta} + \frac{(y-\beta)^2}{n-\beta} \\ &=& \frac{\frac{1}{2} d^2}{\beta} + \frac{\frac{1}{2} d^2}{n-\beta} + \frac{\frac{1}{2} d^2}{\beta} + \frac{\frac{1}{2} d^2}{n-\beta} \\ \\ &= &\frac{d^2}{(0.5n-\beta^\prime)(0.5n+\beta^\prime)} \\ & \approx& \frac{d^2}{(0.5 n)^2} \end{array}$$ where in the end we used $\beta^\prime = \beta-0.5n$

What if $E_i$ happens to be far from the true expected value?

So in the view of the $\chi^2$ statistic approaching the chi-squared distribution as the above-explained approximation we see the influence of $E_i$ disappear in two points.

  1. The error terms in the numerator $(O_i - E_i)^2$ are like the residuals, and independently$^1$ distributed from the estimate $E_i$.
  2. The expression of $E_i$ in the denominator has only a very small influence if the numbers are high. The numbers $E_i$ vary only a little, but also the increase of one $E_i$ is paired with the decrease of another $E_i$, and this dampens the effect on the chi-squared statistic.

1) an example/illustration of this independence is made with the following image and R-code

independence

set.seed(1)
O1 = rbinom(n,100,0.5)
O2 = rbinom(n,100,0.5)
E1 = 0.5*(O1+O2)
plot(O1-E1, E1)
Source Link
Sextus Empiricus
  • 86.4k
  • 6
  • 115
  • 301
Loading