added 80 characters in body
Source Link
zhaokg
  • 698
  • 3
  • 15

If you are working on time series data or 1D univariate sequence data, a possible package available in R, Python, and Matlab is Rbeast (https://github.com/zhaokg/Rbeast). It is a Bayesian changepoint detection algorithm that can handle missing data; it can also decompose time series into periodic and trend components, if needed. Below are some quick examples using the Nile river flow and COVID-19 daily new cases data:

library(Rbeast)

####         The full time series                  ####
plot( beast(Nile) , main='Changepoint analysis for the full dataset')

####Introduce NAs at 40 random locations out of 100####
set.seed(1234)
NileNA = Nile
NileNA[ sample(length(NileNA),40)  ]= NA

plot(beast(NileNA), main='Changepoint analaysis with 40 missing datapoints')

enter image description here

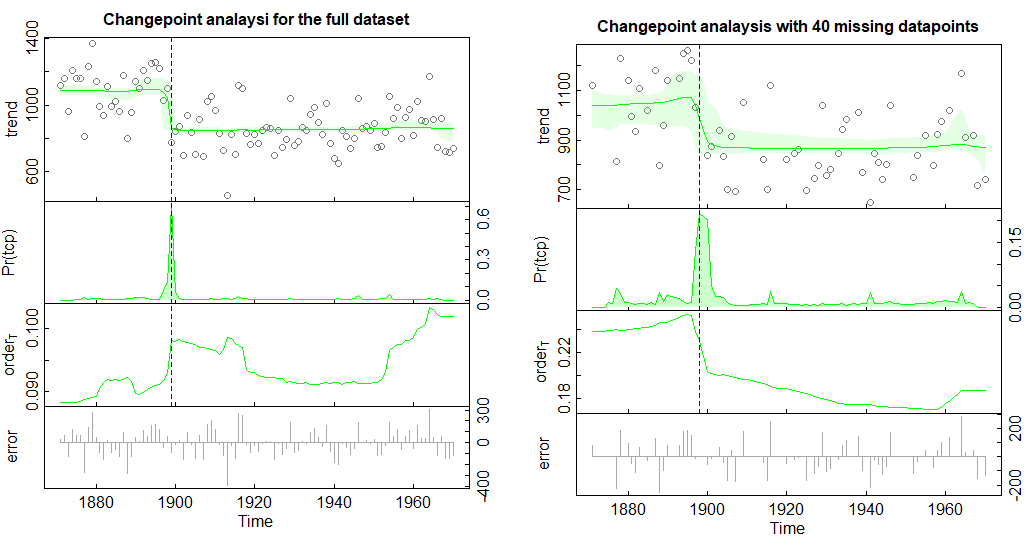
beast estimates the probability of changepoint occurrence over time, which is the green Pr(tcp) curve above. The peak corresponds to the region/point where the changepoints are most likely to occur.

###covid19 is a daily time series with a weekly cyclic component (i.e., freq=7)
startdate  = as.numeric(covid19$date[1]) 
out        = beast(sqrt(covid19$newcases), start= startdate, deltat=1, freq=7)
out$time   = as.Date(out$time, origin='1970-01-01') # Convert from integers to Date.

plot( out, main='Changepoint analaysi for the full dataset')

###Introduce NAs at 200 random locations out of 694
set.seed(1234)
newcasesNA = covid19$newcases
newcasesNA[ sample(length(newcasesNA), 200)  ]= NA
out1          = beast(sqrt(newcasesNA), start= startdate, deltat=1, freq=7)
out1$time     = as.Date(out1$time, origin='1970-01-01') # Convert from integers to Date.

plot( out1, main='Changepoint analaysis with 200 missing datapoints')

enter image description here

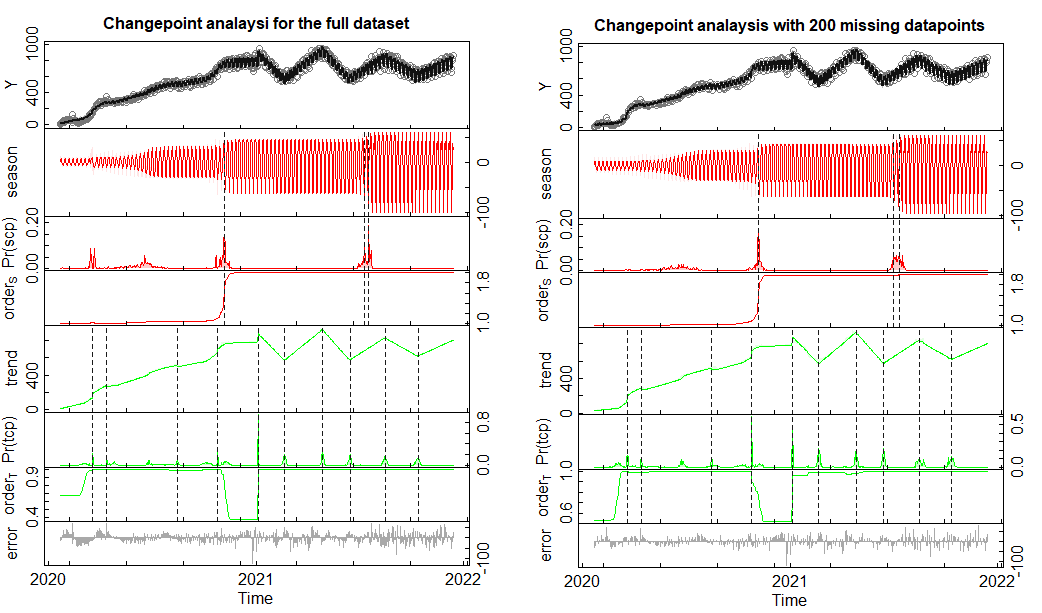
In the figure above, the time series was decomposed into two components: a periodic curve together with periodic structural changes (i.e., Pr(scp), and a trend curve together with trend changepoints (i.e., Pr(tcp)).

If you are working on time series data or 1D univariate sequence data, a possible package in R is Rbeast. It is a Bayesian changepoint detection algorithm that can handle missing data; it can also decompose time series into periodic and trend components, if needed. Below are some quick examples using the Nile river flow and COVID-19 daily new cases data:

library(Rbeast)

####         The full time series                  ####
plot( beast(Nile) , main='Changepoint analysis for the full dataset')

####Introduce NAs at 40 random locations out of 100####
set.seed(1234)
NileNA = Nile
NileNA[ sample(length(NileNA),40)  ]= NA

plot(beast(NileNA), main='Changepoint analaysis with 40 missing datapoints')

enter image description here

beast estimates the probability of changepoint occurrence over time, which is the green Pr(tcp) curve above. The peak corresponds to the region/point where the changepoints are most likely to occur.

###covid19 is a daily time series with a weekly cyclic component (i.e., freq=7)
startdate  = as.numeric(covid19$date[1]) 
out        = beast(sqrt(covid19$newcases), start= startdate, deltat=1, freq=7)
out$time   = as.Date(out$time, origin='1970-01-01') # Convert from integers to Date.

plot( out, main='Changepoint analaysi for the full dataset')

###Introduce NAs at 200 random locations out of 694
set.seed(1234)
newcasesNA = covid19$newcases
newcasesNA[ sample(length(newcasesNA), 200)  ]= NA
out1          = beast(sqrt(newcasesNA), start= startdate, deltat=1, freq=7)
out1$time     = as.Date(out1$time, origin='1970-01-01') # Convert from integers to Date.

plot( out1, main='Changepoint analaysis with 200 missing datapoints')

enter image description here

In the figure above, the time series was decomposed into two components: a periodic curve together with periodic structural changes (i.e., Pr(scp), and a trend curve together with trend changepoints (i.e., Pr(tcp)).
If you are working on time series data or 1D univariate sequence data, a possible package available in R, Python, and Matlab is Rbeast (https://github.com/zhaokg/Rbeast). It is a Bayesian changepoint detection algorithm that can handle missing data; it can also decompose time series into periodic and trend components, if needed. Below are some quick examples using the Nile river flow and COVID-19 daily new cases data:

library(Rbeast)

####         The full time series                  ####
plot( beast(Nile) , main='Changepoint analysis for the full dataset')

####Introduce NAs at 40 random locations out of 100####
set.seed(1234)
NileNA = Nile
NileNA[ sample(length(NileNA),40)  ]= NA

plot(beast(NileNA), main='Changepoint analaysis with 40 missing datapoints')

enter image description here

beast estimates the probability of changepoint occurrence over time, which is the green Pr(tcp) curve above. The peak corresponds to the region/point where the changepoints are most likely to occur.

###covid19 is a daily time series with a weekly cyclic component (i.e., freq=7)
startdate  = as.numeric(covid19$date[1]) 
out        = beast(sqrt(covid19$newcases), start= startdate, deltat=1, freq=7)
out$time   = as.Date(out$time, origin='1970-01-01') # Convert from integers to Date.

plot( out, main='Changepoint analaysi for the full dataset')

###Introduce NAs at 200 random locations out of 694
set.seed(1234)
newcasesNA = covid19$newcases
newcasesNA[ sample(length(newcasesNA), 200)  ]= NA
out1          = beast(sqrt(newcasesNA), start= startdate, deltat=1, freq=7)
out1$time     = as.Date(out1$time, origin='1970-01-01') # Convert from integers to Date.

plot( out1, main='Changepoint analaysis with 200 missing datapoints')

enter image description here

In the figure above, the time series was decomposed into two components: a periodic curve together with periodic structural changes (i.e., Pr(scp), and a trend curve together with trend changepoints (i.e., Pr(tcp)).

added 425 characters in body
Source Link
zhaokg
  • 698
  • 3
  • 15

If you are working on time series data or 1D univariate sequence data, a possible package in R is Rbeast. It is a Bayesian changepoint detection algorithm that can handle missing data; it can also decompose time series into periodic and trend components, if needed. Below are some quick examples using the Nile river flow and COVID-19 daily new cases data:

library(Rbeast)

####         The full time series                  ####
plot( beast(Nile) , main='Changepoint analysis for the full dataset')

####Introduce NAs at 40 random locations out of 100####
set.seed(1234)
NileNA = Nile
NileNA[ sample(length(NileNA),40)  ]= NA

plot(beast(NileNA), main='Changepoint analaysis with 40 missing datapoints')

enter image description here

beast estimates the probability of changepoint occurrence over time, which is the green Pr(tcp) curve above. The peak corresponds to the region/point where the changepoints are most likely to occur.

###covid19 is a daily time series with a weekly cyclic component (i.e., freq=7)
startdate  = as.numeric(covid19$date[1]) 
out        = beast(sqrt(covid19$newcases), start= startdate, deltat=1, freq=7)
out$time   = as.Date(out$time, origin='1970-01-01') # Convert from integers to Date.

plot( out, main='Changepoint analaysi for the full dataset')

###Introduce NAs at 200 random locations out of 694
set.seed(1234)
newcasesNA = covid19$newcases
newcasesNA[ sample(length(newcasesNA), 200)  ]= NA
out1          = beast(sqrt(newcasesNA), start= startdate, deltat=1, freq=7)
out1$time     = as.Date(out1$time, origin='1970-01-01') # Convert from integers to Date.

plot( out1, main='Changepoint analaysis with 200 missing datapoints')

enter image description here

In the figure above, the time series was decomposed into two components: a periodic curve together with periodic structural changes (i.e., Pr(scp), and a trend curve together with trend changepoints (i.e., Pr(tcp)).

If you are working on time series data or 1D univariate sequence data, a possible package in R is Rbeast. It is a Bayesian changepoint detection algorithm that can handle missing data; it can also decompose time series into periodic and trend components, if needed. Below are some quick examples using the Nile river flow and COVID-19 daily new cases data:

library(Rbeast)

####         The full time series                  ####
plot( beast(Nile) , main='Changepoint analysis for the full dataset')

####Introduce NAs at 40 random locations out of 100####
set.seed(1234)
NileNA = Nile
NileNA[ sample(length(NileNA),40)  ]= NA

plot(beast(NileNA), main='Changepoint analaysis with 40 missing datapoints')

enter image description here

###covid19 is a daily time series with a weekly cyclic component (i.e., freq=7)
startdate  = as.numeric(covid19$date[1]) 
out        = beast(sqrt(covid19$newcases), start= startdate, deltat=1, freq=7)
out$time   = as.Date(out$time, origin='1970-01-01') # Convert from integers to Date.

plot( out, main='Changepoint analaysi for the full dataset')

###Introduce NAs at 200 random locations out of 694
set.seed(1234)
newcasesNA = covid19$newcases
newcasesNA[ sample(length(newcasesNA), 200)  ]= NA
out1          = beast(sqrt(newcasesNA), start= startdate, deltat=1, freq=7)
out1$time     = as.Date(out1$time, origin='1970-01-01') # Convert from integers to Date.

plot( out1, main='Changepoint analaysis with 200 missing datapoints')

enter image description here

If you are working on time series data or 1D univariate sequence data, a possible package in R is Rbeast. It is a Bayesian changepoint detection algorithm that can handle missing data; it can also decompose time series into periodic and trend components, if needed. Below are some quick examples using the Nile river flow and COVID-19 daily new cases data:

library(Rbeast)

####         The full time series                  ####
plot( beast(Nile) , main='Changepoint analysis for the full dataset')

####Introduce NAs at 40 random locations out of 100####
set.seed(1234)
NileNA = Nile
NileNA[ sample(length(NileNA),40)  ]= NA

plot(beast(NileNA), main='Changepoint analaysis with 40 missing datapoints')

enter image description here

beast estimates the probability of changepoint occurrence over time, which is the green Pr(tcp) curve above. The peak corresponds to the region/point where the changepoints are most likely to occur.

###covid19 is a daily time series with a weekly cyclic component (i.e., freq=7)
startdate  = as.numeric(covid19$date[1]) 
out        = beast(sqrt(covid19$newcases), start= startdate, deltat=1, freq=7)
out$time   = as.Date(out$time, origin='1970-01-01') # Convert from integers to Date.

plot( out, main='Changepoint analaysi for the full dataset')

###Introduce NAs at 200 random locations out of 694
set.seed(1234)
newcasesNA = covid19$newcases
newcasesNA[ sample(length(newcasesNA), 200)  ]= NA
out1          = beast(sqrt(newcasesNA), start= startdate, deltat=1, freq=7)
out1$time     = as.Date(out1$time, origin='1970-01-01') # Convert from integers to Date.

plot( out1, main='Changepoint analaysis with 200 missing datapoints')

enter image description here

In the figure above, the time series was decomposed into two components: a periodic curve together with periodic structural changes (i.e., Pr(scp), and a trend curve together with trend changepoints (i.e., Pr(tcp)).

Source Link
zhaokg
  • 698
  • 3
  • 15

If you are working on time series data or 1D univariate sequence data, a possible package in R is Rbeast. It is a Bayesian changepoint detection algorithm that can handle missing data; it can also decompose time series into periodic and trend components, if needed. Below are some quick examples using the Nile river flow and COVID-19 daily new cases data:

library(Rbeast)

####         The full time series                  ####
plot( beast(Nile) , main='Changepoint analysis for the full dataset')

####Introduce NAs at 40 random locations out of 100####
set.seed(1234)
NileNA = Nile
NileNA[ sample(length(NileNA),40)  ]= NA

plot(beast(NileNA), main='Changepoint analaysis with 40 missing datapoints')

enter image description here

###covid19 is a daily time series with a weekly cyclic component (i.e., freq=7)
startdate  = as.numeric(covid19$date[1]) 
out        = beast(sqrt(covid19$newcases), start= startdate, deltat=1, freq=7)
out$time   = as.Date(out$time, origin='1970-01-01') # Convert from integers to Date.

plot( out, main='Changepoint analaysi for the full dataset')

###Introduce NAs at 200 random locations out of 694
set.seed(1234)
newcasesNA = covid19$newcases
newcasesNA[ sample(length(newcasesNA), 200)  ]= NA
out1          = beast(sqrt(newcasesNA), start= startdate, deltat=1, freq=7)
out1$time     = as.Date(out1$time, origin='1970-01-01') # Convert from integers to Date.

plot( out1, main='Changepoint analaysis with 200 missing datapoints')

enter image description here