loaded figure; light editing
Source Link
gung - Reinstate Monica
  • 147.5k
  • 89
  • 406
  • 717

I'm reading the technical manual for a linking study between two assessments. It's pretty clear that the table is model output from a fitted logistic regression equation. Here's Here's what pass odds look like on test 2 as a function of score on test 1 (RIT score).:
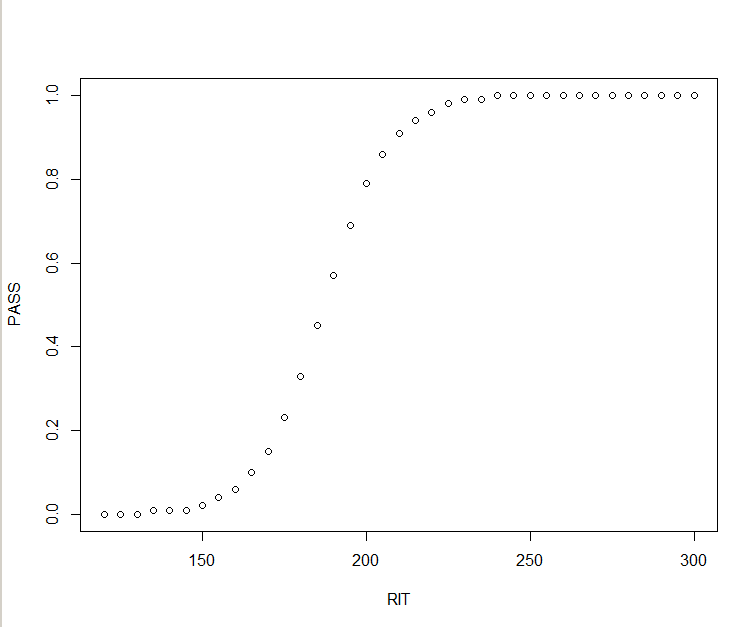
enter image description here

It seems silly to use a lookup table that rounds to 5 when the model that made that table could give a better estimate. But how do I recreate that equation from this output? I

I have a good sense of how I would fit this model if I had the raw data, but I'm not sure what to do here. Not glm(family=binomial) because the data I have is are odds ratios, not pass  /no no pass (i.e., 1s and 0s -), right?

Here's the data:

PASS <- c(0, 0, 0, 0.01, 0.01, 0.01, 0.02, 0.04, 0.06, 0.1, 0.15, 0.23, 
0.33, 0.45, 0.57, 0.69, 0.79, 0.86, 0.91, 0.94, 0.96, 0.98, 0.99, 
0.99, 1, 1, 1, 1, 1, 1, 1, 1, 1, 1, 1, 1, 1)

RIT <- c(120L, 125L, 130L, 135L, 140L, 145L, 150L, 155L, 160L, 165L, 
170L, 175L, 180L, 185L, 190L, 195L, 200L, 205L, 210L, 215L, 220L, 
225L, 230L, 235L, 240L, 245L, 250L, 255L, 260L, 265L, 270L, 275L, 
280L, 285L, 290L, 295L, 300L)

I'm reading the technical manual for a linking study between two assessments. It's pretty clear that the table is model output from a fitted logistic regression equation. Here's what pass odds look like on test 2 as a function of score on test 1 (RIT score).

It seems silly to use a lookup table that rounds to 5 when the model that made that table could give a better estimate. But how do I recreate that equation from this output? I have a good sense of how I would fit this model if I had the raw data, but I'm not sure what to do here. Not glm(family=binomial) because the data I have is are odds ratios, not pass/no pass 1s and 0s - right?

Here's the data:

PASS <- c(0, 0, 0, 0.01, 0.01, 0.01, 0.02, 0.04, 0.06, 0.1, 0.15, 0.23, 
0.33, 0.45, 0.57, 0.69, 0.79, 0.86, 0.91, 0.94, 0.96, 0.98, 0.99, 
0.99, 1, 1, 1, 1, 1, 1, 1, 1, 1, 1, 1, 1, 1)

RIT <- c(120L, 125L, 130L, 135L, 140L, 145L, 150L, 155L, 160L, 165L, 
170L, 175L, 180L, 185L, 190L, 195L, 200L, 205L, 210L, 215L, 220L, 
225L, 230L, 235L, 240L, 245L, 250L, 255L, 260L, 265L, 270L, 275L, 
280L, 285L, 290L, 295L, 300L)

I'm reading the technical manual for a linking study between two assessments. It's pretty clear that the table is model output from a fitted logistic regression equation. Here's what pass odds look like on test 2 as a function of score on test 1 (RIT score):

enter image description here

It seems silly to use a lookup table that rounds to 5 when the model that made that table could give a better estimate. But how do I recreate that equation from this output?

I have a good sense of how I would fit this model if I had the raw data, but I'm not sure what to do here. Not glm(family=binomial) because the data I have is are odds ratios, not pass  / no pass (i.e., 1s and 0s), right?

Here's the data:

PASS <- c(0, 0, 0, 0.01, 0.01, 0.01, 0.02, 0.04, 0.06, 0.1, 0.15, 0.23, 
0.33, 0.45, 0.57, 0.69, 0.79, 0.86, 0.91, 0.94, 0.96, 0.98, 0.99, 
0.99, 1, 1, 1, 1, 1, 1, 1, 1, 1, 1, 1, 1, 1)

RIT <- c(120L, 125L, 130L, 135L, 140L, 145L, 150L, 155L, 160L, 165L, 
170L, 175L, 180L, 185L, 190L, 195L, 200L, 205L, 210L, 215L, 220L, 
225L, 230L, 235L, 240L, 245L, 250L, 255L, 260L, 265L, 270L, 275L, 
280L, 285L, 290L, 295L, 300L)
Source Link

Recreate logistic regression equation from table of odds data

I'm reading the technical manual for a linking study between two assessments. It's pretty clear that the table is model output from a fitted logistic regression equation. Here's what pass odds look like on test 2 as a function of score on test 1 (RIT score).

It seems silly to use a lookup table that rounds to 5 when the model that made that table could give a better estimate. But how do I recreate that equation from this output? I have a good sense of how I would fit this model if I had the raw data, but I'm not sure what to do here. Not glm(family=binomial) because the data I have is are odds ratios, not pass/no pass 1s and 0s - right?

Here's the data:

PASS <- c(0, 0, 0, 0.01, 0.01, 0.01, 0.02, 0.04, 0.06, 0.1, 0.15, 0.23, 
0.33, 0.45, 0.57, 0.69, 0.79, 0.86, 0.91, 0.94, 0.96, 0.98, 0.99, 
0.99, 1, 1, 1, 1, 1, 1, 1, 1, 1, 1, 1, 1, 1)

RIT <- c(120L, 125L, 130L, 135L, 140L, 145L, 150L, 155L, 160L, 165L, 
170L, 175L, 180L, 185L, 190L, 195L, 200L, 205L, 210L, 215L, 220L, 
225L, 230L, 235L, 240L, 245L, 250L, 255L, 260L, 265L, 270L, 275L, 
280L, 285L, 290L, 295L, 300L)