resolved image link problems
Source Link
wolfies
  • 8k
  • 1
  • 29
  • 31

It's a two-component-mix of a Uniform(-1,1) and a Triangular(-1,1).

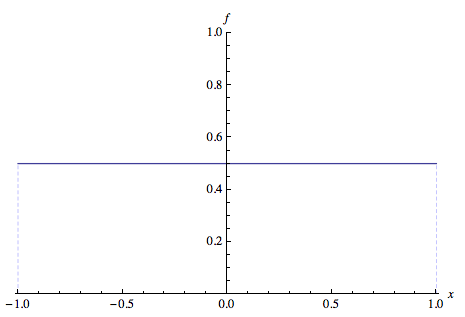
To see this, let f(x) denote our Uniform(-1,1) pdf:

f = 1/2;  domain[f] = {x, -1, 1};      
PlotDensity[f]
http://www.tri.org.au/pdff.png

enter image description here

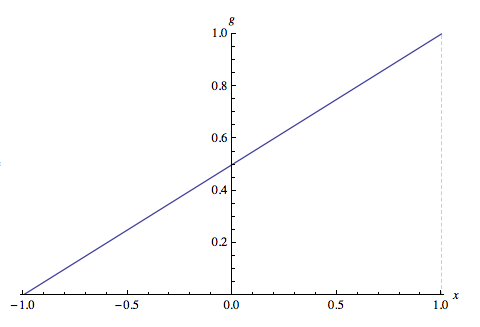
and let g(x) denote our Triangular(-1,1) pdf:

g = (1 + x)/2; domain[g] = {x, -1, 1};      
PlotDensity[g]
http://www.tri.org.au/pdfg.png

enter image description here

Then, define the two-component mix pdf h(x):

h = (1 - α) f + α g  // FullSimplify

which returns output:

$(1 + x \alpha)/2$

with domain of support:

domain[h] = {x, -1, 1}  && {-1 <= α <= 1};  

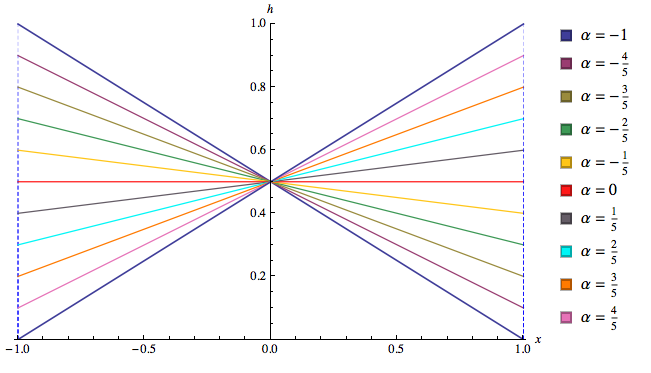
Here is a plot of the two-component-mix pdf (using mathStatica/Mathematica):

PlotDensity[h /. α -> Range[-5, 5]/5]
http://www.tri.org.au/pdfmix.png

enter image description here

Having said all that, I think it deserves its own name (if it does not have one already) and suggest: Linear distribution

It's a two-component-mix of a Uniform(-1,1) and a Triangular(-1,1).

To see this, let f(x) denote our Uniform(-1,1) pdf:

f = 1/2;  domain[f] = {x, -1, 1};      
PlotDensity[f]
http://www.tri.org.au/pdff.png

and let g(x) denote our Triangular(-1,1) pdf:

g = (1 + x)/2; domain[g] = {x, -1, 1};      
PlotDensity[g]
http://www.tri.org.au/pdfg.png

Then, define the two-component mix pdf h(x):

h = (1 - α) f + α g  // FullSimplify

which returns output:

$(1 + x \alpha)/2$

with domain of support:

domain[h] = {x, -1, 1}  && {-1 <= α <= 1};  

Here is a plot of the two-component-mix pdf (using mathStatica/Mathematica):

PlotDensity[h /. α -> Range[-5, 5]/5]
http://www.tri.org.au/pdfmix.png

Having said all that, I think it deserves its own name (if it does not have one already) and suggest: Linear distribution
It's a two-component-mix of a Uniform(-1,1) and a Triangular(-1,1).

To see this, let f(x) denote our Uniform(-1,1) pdf:

f = 1/2;  domain[f] = {x, -1, 1};      
PlotDensity[f]

enter image description here

and let g(x) denote our Triangular(-1,1) pdf:

g = (1 + x)/2; domain[g] = {x, -1, 1};      
PlotDensity[g]

enter image description here

Then, define the two-component mix pdf h(x):

h = (1 - α) f + α g  // FullSimplify

which returns output:

$(1 + x \alpha)/2$

with domain of support:

domain[h] = {x, -1, 1}  && {-1 <= α <= 1};  

Here is a plot of the two-component-mix pdf (using mathStatica/Mathematica):

PlotDensity[h /. α -> Range[-5, 5]/5]

enter image description here

Having said all that, I think it deserves its own name (if it does not have one already) and suggest: Linear distribution
added 194 characters in body
Source Link
whuber
  • 333.6k
  • 63
  • 792
  • 1.3k

It's a two-component-mix of a Uniform(-1,1) and a Triangular(-1,1).

To see this, let f(x) denote our Uniform(-1,1) pdf:

f = 1/2;  domain[f] = {x, -1, 1};      PlotDensity[f]
f = 1/2;  domain[f] = {x, -1, 1};      
PlotDensity[f]
http://www.tri.org.au/pdff.png

and let g(x) denote our Triangular(-1,1) pdf:

g = (1 + x)/2; domain[g] = {x, -1, 1};      PlotDensity[g]
g = (1 + x)/2; domain[g] = {x, -1, 1};      
PlotDensity[g]
http://www.tri.org.au/pdfg.png

Then, define the two-component mix pdf h(x):

h = (1 - $\alpha$) f + $\alpha$ g // FullSimplify

h = (1 - α) f + α g  // FullSimplify

which returns output:

(1 + x $\alpha$)/2$(1 + x \alpha)/2$

with domain of support:

domain[h] = {x, -1, 1}  && {-1 <= α <= 1};  

Here is a plot of the two-component-mix pdf (using mathStatica/Mathematica):

PlotDensity[h /. $\alpha$ -> Range[-5, 5]/5]

PlotDensity[h /. α -> Range[-5, 5]/5]
http://www.tri.org.au/pdfmix.png

Having said all that, I think it deserves its own name (if it does not have one already) and suggest: Linear distribution

It's a two-component-mix of a Uniform(-1,1) and a Triangular(-1,1).

To see this, let f(x) denote our Uniform(-1,1) pdf:

f = 1/2;  domain[f] = {x, -1, 1};      PlotDensity[f]
http://www.tri.org.au/pdff.png

and let g(x) denote our Triangular(-1,1) pdf:

g = (1 + x)/2; domain[g] = {x, -1, 1};      PlotDensity[g]
http://www.tri.org.au/pdfg.png

Then, define the two-component mix pdf h(x):

h = (1 - $\alpha$) f + $\alpha$ g // FullSimplify

which returns output:

(1 + x $\alpha$)/2

with domain of support:

domain[h] = {x, -1, 1}  && {-1 <= α <= 1};  

Here is a plot of the two-component-mix pdf (using mathStatica/Mathematica):

PlotDensity[h /. $\alpha$ -> Range[-5, 5]/5]

http://www.tri.org.au/pdfmix.png

Having said all that, I think it deserves its own name (if it does not have one already) and suggest: Linear distribution

It's a two-component-mix of a Uniform(-1,1) and a Triangular(-1,1).

To see this, let f(x) denote our Uniform(-1,1) pdf:

f = 1/2;  domain[f] = {x, -1, 1};      
PlotDensity[f]
http://www.tri.org.au/pdff.png

and let g(x) denote our Triangular(-1,1) pdf:

g = (1 + x)/2; domain[g] = {x, -1, 1};      
PlotDensity[g]
http://www.tri.org.au/pdfg.png

Then, define the two-component mix pdf h(x):

h = (1 - α) f + α g  // FullSimplify

which returns output:

$(1 + x \alpha)/2$

with domain of support:

domain[h] = {x, -1, 1}  && {-1 <= α <= 1};  

Here is a plot of the two-component-mix pdf (using mathStatica/Mathematica):

PlotDensity[h /. α -> Range[-5, 5]/5]
http://www.tri.org.au/pdfmix.png

Having said all that, I think it deserves its own name (if it does not have one already) and suggest: Linear distribution

Source Link
wolfies
  • 8k
  • 1
  • 29
  • 31

It's a two-component-mix of a Uniform(-1,1) and a Triangular(-1,1).

To see this, let f(x) denote our Uniform(-1,1) pdf:

f = 1/2;  domain[f] = {x, -1, 1};      PlotDensity[f]
http://www.tri.org.au/pdff.png

and let g(x) denote our Triangular(-1,1) pdf:

g = (1 + x)/2; domain[g] = {x, -1, 1};      PlotDensity[g]
http://www.tri.org.au/pdfg.png

Then, define the two-component mix pdf h(x):

h = (1 - $\alpha$) f + $\alpha$ g // FullSimplify

which returns output:

(1 + x $\alpha$)/2

with domain of support:

domain[h] = {x, -1, 1}  && {-1 <= α <= 1};  

Here is a plot of the two-component-mix pdf (using mathStatica/Mathematica):

PlotDensity[h /. $\alpha$ -> Range[-5, 5]/5]

http://www.tri.org.au/pdfmix.png

Having said all that, I think it deserves its own name (if it does not have one already) and suggest: Linear distribution