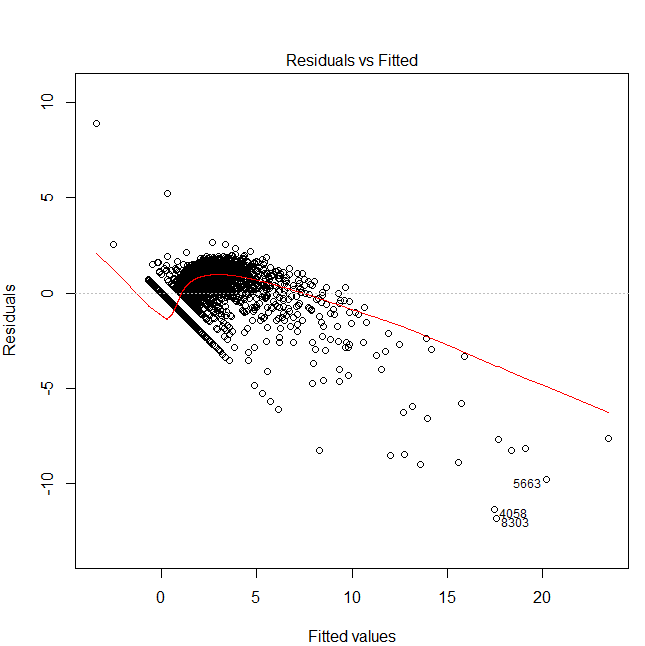
I'm doing a multivariate linear regression with R, and i find myself with the following residuals vs fitted plot:

As you can see there is a very regular line of points that seems to follow a precise pattern.
My questions are:
- How do I interpret such a behavior, and what can I do to fix it?
- Is there a way to isolate/extract those points? I'd like to take a look at them individually in my data set to see if by examining them I notice some patterns in the data.
Additional info: My model is:
v.lm = lm(sqrt(v.stima$Y)~., data=v.stima)
Y is a count-variable (non-negative integer). I'm using sqrt because without it the plot has the typical "funnel" shape that indicates a non-homoscedastic error.
