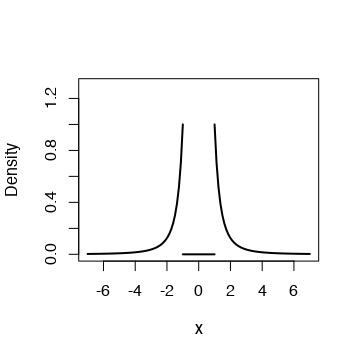
Note that yours is not a valid probability density function.
Indeed, you have $f(x)< 0$, for all $x< -1$. But, by definition, a PDF is always non-negative, ie. $$f(x)\geq 0, \text{ for all } x.$$
In addition,
$$ \int_{-\infty}^{-1} 1/x^3\,dx + \int_{1}^{\infty} 1/x^3\, dx= -\frac{1}{2}+\frac{1}{2}=0. $$ Thus the CDF is also not valid either.
Update Note
Note: The above post refers to the original question. Below is the answer to the updated question.
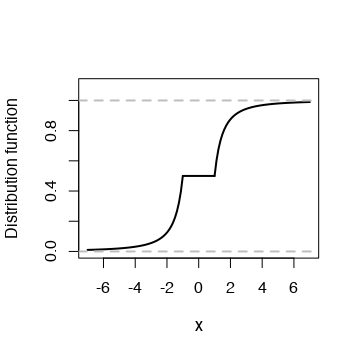
For this pdf the CDF is
$$ F(x) = \begin{cases} \frac{1}{2x^2}& \text{ if } x\leq -1\\ \frac{1}{2} & \text{ if } x\in[0,1]\\ 1-\frac{1}{2x^2}& \text{ if } x>1 \end{cases}. $$
Below you can see the PDF, the CDF and the relative R code.
ff_pdf <- function(x) abs(1/x^3)
ff_cdf_l <- function(x) (1/(2*x^2))
ff_cdf_r <- function(x) 1/2 + 1/2 - 1/(2*x^2)

x_l <- seq(-7,-1,len=50)
x_r <- seq(1,7,len=50)
pdfv_l <- sapply(x_l, ff_pdf)
pdfv_r <- sapply(x_r, ff_pdf)


plot(x_l, pdfv_l, type = "l", xlim=c(-7,7),
     lwd=2, ylim=c(0,1.3), ylab = "Density", xlab="x")
points(x_r, pdfv_r, type = "l", xlim=c(-7,7), lwd=2)
segments(x0=-1, y0=0, x1=1, y1=0, lwd=2)


cdfv_l <- sapply(x_l, ff_cdf_l)
cdfv_r <- sapply(x_r, ff_cdf_r)


plot(x_l, cdfv_l, type = "l", xlim=c(-7,7),
     lwd=2, ylim=c(0,1.1), ylab = "Distribution function", xlab="x")
segments(x0=-1, y0=1/2, x1=1, y1=1/2, lwd=2)
points(x_r, cdfv_r, type = "l",lwd=2)
abline(h = c(0,1), lwd=2, lty=2, col="gray")


