replaced http://stackoverflow.com/ with https://stackoverflow.com/
Source Link
further clarification and grammar
Source Link
Glen_b
  • 290.5k
  • 37
  • 652
  • 1.1k

I tried to seek itfind one by changing the model and initial approximation (ln 15-16) atin this simple Python program:

The best result that I managed to get with the method described is shown in in the graph below:

graph.

DatafileThe datafile is here. I need to find a dependence of the second column from the first.

I think, I want to build a model which contains a periodical component, with "top-trend" and "bottom-trend" components, last two are independent.

I tried to seek it by changing model and initial approximation (ln 15-16) at this simple Python program:

The best result that I managed to get with the method described shown in in the graph:

graph.

Datafile is here. I need to find a dependence of the second column from the first.

I think, I want to build a model which contains a periodical component, "top-trend" and "bottom-trend" components, last two are independent.

I tried to find one by changing the model and initial approximation (ln 15-16) in this simple Python program:

The best result that I managed to get with the method described is shown in in the graph below:

graph

The datafile is here. I need to find a dependence of the second column from the first.

I think I want to build a model which contains a periodical component, with "top-trend" and "bottom-trend" components, last two are independent.

grammar, formatting, included graph rather than a link to it
Source Link
Glen_b
  • 290.5k
  • 37
  • 652
  • 1.1k

Here, firstly I try to find a periodic pattern ((p[0] + p[1] * np.exp(np.sin((np.pi / p[2]) * x + p[3]))**3)) while p[i] are variatingvarying parameters, then approximatingapproximate the remains of the first regression with second, polynomial regression.

The best result that I managed to get with the method described shown in in the graphgraph:
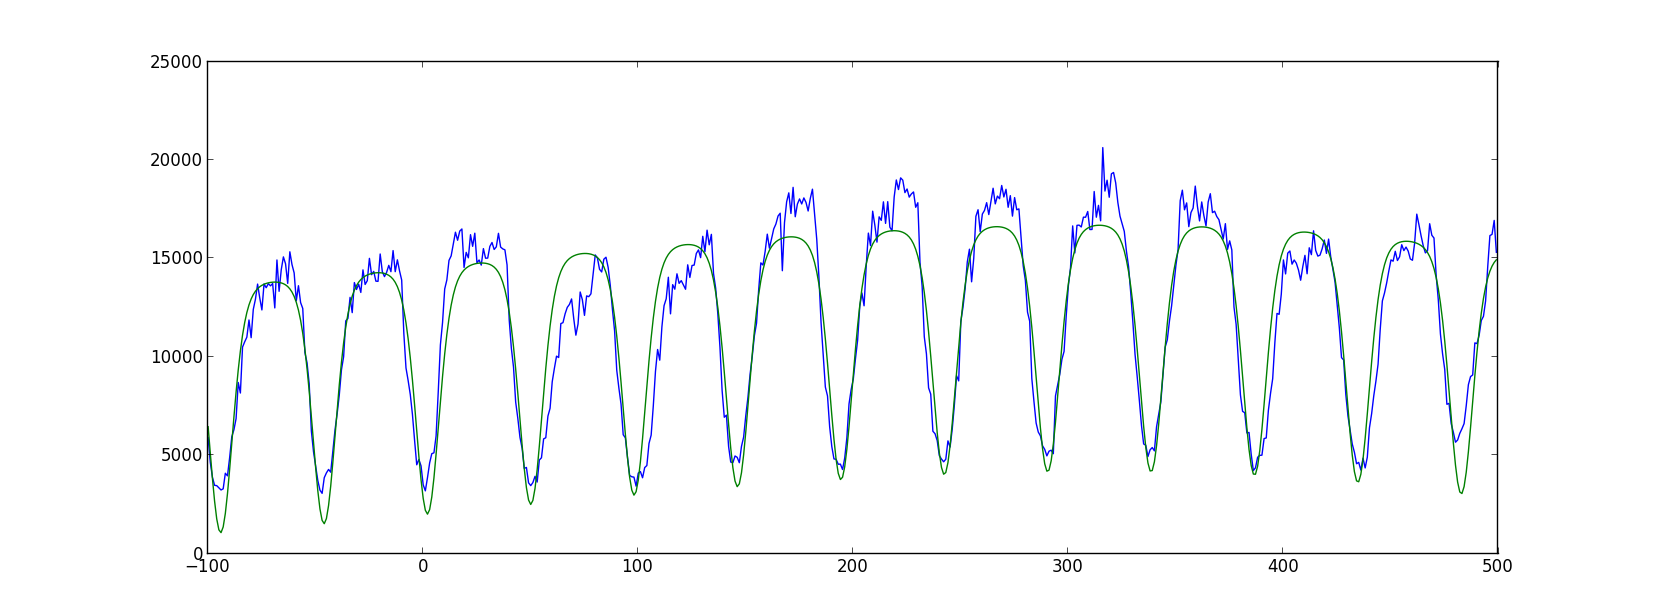
graph.

I'm pleased with how the fit is approaching the bottom part of the graph, but topsthe top parts I just do not like.

I think, I want to build a model which contains a periodical component, "top-trend" and "bottom-trend" components, last two are indipendentindependent.

Here, firstly I try to find a periodic pattern ((p[0] + p[1] * np.exp(np.sin((np.pi / p[2]) * x + p[3]))**3)) while p[i] are variating parameters, then approximating the remains of the first regression with second, polynomial regression.

The best result that I managed to get with the method described shown in the graph.

I'm pleased with how approaching the bottom part of the graph, but tops I just do not like.

I think, I want to build a model which contains a periodical component, "top-trend" and "bottom-trend" components, last two are indipendent.

Here, firstly I try to find a periodic pattern ((p[0] + p[1] * np.exp(np.sin((np.pi / p[2]) * x + p[3]))**3)) while p[i] are varying parameters, then approximate the remains of the first regression with second, polynomial regression.

The best result that I managed to get with the method described shown in in the graph:

graph.

I'm pleased with how the fit is approaching the bottom part of the graph, but the top parts I just do not like.

I think, I want to build a model which contains a periodical component, "top-trend" and "bottom-trend" components, last two are independent.

Source Link
Loading