deleted 161 characters in body
Source Link
An116
  • 367
  • 1
  • 2
  • 8

I applied logistic regression to check the relationship between a binary variable that is called FG and thefew independent variables that are listed as follows :

enter image description here

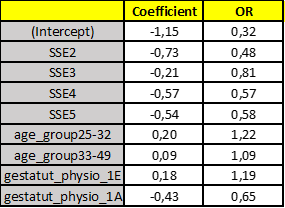
the reference group for the variable SSE is SSE1. The OR is 0.48 meaning that the chances for those in SSE2 (from the same age group and the same physiological status) decrease by 52% to be in FG group 1 compared to those from SSE1.

However now when considering SSE2 as the reference group I have this following table :

enter image description here

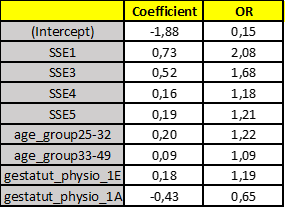
now OR for SSE1 is 2.08 meaning the chances for SSE1 are 108% higher to be in FG group 1 compared to those from SSE2. Is it logical this way or am I making some interpretation error (because I thought that the resulted OR must indicate 52% more of chances) ? Thanks.

I applied logistic regression to check the relationship between a binary variable that is called FG and the independent variables that are listed as follows :

enter image description here

the reference group for the variable SSE is SSE1. The OR is 0.48 meaning that the chances for those in SSE2 (from the same age group and the same physiological status) decrease by 52% to be in FG group 1 compared to those from SSE1.

However now when considering SSE2 as the reference group I have this following table :

enter image description here

now OR for SSE1 is 2.08 meaning the chances for SSE1 are 108% higher to be in FG group 1 compared to those from SSE2. Is it logical this way or am I making some interpretation error (because I thought that the resulted OR must indicate 52% more of chances) ? Thanks.
I applied logistic regression to check the relationship between a binary variable that is called FG and few independent variables

the reference group for the variable SSE is SSE1. The OR is 0.48 meaning that the chances for those in SSE2 (from the same age group and the same physiological status) decrease by 52% to be in FG group 1 compared to those from SSE1.

However now when considering SSE2 as the reference group :

now OR for SSE1 is 2.08 meaning the chances for SSE1 are 108% higher to be in FG group 1 compared to those from SSE2. Is it logical this way or am I making some interpretation error (because I thought that the resulted OR must indicate 52% more of chances) ? Thanks.

Source Link
An116
  • 367
  • 1
  • 2
  • 8

interpreting logistic regression coefficients when reversing the reference group

I applied logistic regression to check the relationship between a binary variable that is called FG and the independent variables that are listed as follows :

enter image description here

the reference group for the variable SSE is SSE1. The OR is 0.48 meaning that the chances for those in SSE2 (from the same age group and the same physiological status) decrease by 52% to be in FG group 1 compared to those from SSE1.

However now when considering SSE2 as the reference group I have this following table :

enter image description here

now OR for SSE1 is 2.08 meaning the chances for SSE1 are 108% higher to be in FG group 1 compared to those from SSE2. Is it logical this way or am I making some interpretation error (because I thought that the resulted OR must indicate 52% more of chances) ? Thanks.