Fixed notation.
Source Link

Given:

$X \sim \mathcal{N}(\mu, \sigma^2)$
$Y|X \sim \mathcal{N}(0, (\theta x)^2)$$Y|X=x \sim \mathcal{N}(0, (\theta x)^2)$
$Z = X + Y$

I want to be able to make hypothesis tests or confidence intervals for $\mu$ using $Z$ and known $\theta$ and $\sigma^2$. For example, I draw $z = 950$, and I have $\sigma^2 = 10000$ and $\theta = 0.10$. How would I estimate a confidence interval for $\mu$ with this information?

Edit:

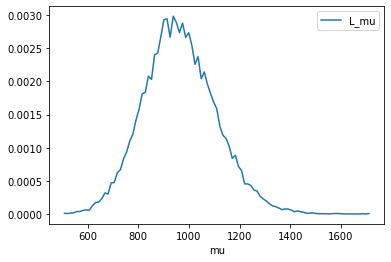
I'm not really sure how to go about this analytically, but I've been able to create confidence intervals numerically. Here's an empirical plot of the likelihood of $\mu$ given the observed $z$ and parameters in the above example.

empirical likelihood plot

Code for the above plot:

import scipy.stats as stats
import numpy as np
import pandas as pd

x_var   = 10000
theta   = 0.10
samples = int(4e7)

df1       = pd.DataFrame(index=range(samples))
df1['mu'] = stats.uniform.rvs(size=samples)*1500+500
df1['x']  = stats.norm.rvs(loc=df1['mu'] , scale=np.sqrt(x_var)         , size=samples)
df1['y']  = stats.norm.rvs(loc=0         , scale=np.abs(theta*df1['x']) , size=samples)
df1['z']  = df1['x'] + df1['y']

z_observed = 950
df1.drop(df1[np.round(df1['z']) != z_observed].index, inplace = True)

hist1 = (pd.DataFrame(np.histogram(df1['mu'],bins=99,density=True))
            .transpose().rename(columns={0: 'L_mu', 1: 'mu'}))
hist1.plot(x='mu',y='L_mu')

Given:

$X \sim \mathcal{N}(\mu, \sigma^2)$
$Y|X \sim \mathcal{N}(0, (\theta x)^2)$
$Z = X + Y$

I want to be able to make hypothesis tests or confidence intervals for $\mu$ using $Z$ and known $\theta$ and $\sigma^2$. For example, I draw $z = 950$, and I have $\sigma^2 = 10000$ and $\theta = 0.10$. How would I estimate a confidence interval for $\mu$ with this information?

Edit:

I'm not really sure how to go about this analytically, but I've been able to create confidence intervals numerically. Here's an empirical plot of the likelihood of $\mu$ given the observed $z$ and parameters in the above example.

empirical likelihood plot

Code for the above plot:

import scipy.stats as stats
import numpy as np
import pandas as pd

x_var   = 10000
theta   = 0.10
samples = int(4e7)

df1       = pd.DataFrame(index=range(samples))
df1['mu'] = stats.uniform.rvs(size=samples)*1500+500
df1['x']  = stats.norm.rvs(loc=df1['mu'] , scale=np.sqrt(x_var)         , size=samples)
df1['y']  = stats.norm.rvs(loc=0         , scale=np.abs(theta*df1['x']) , size=samples)
df1['z']  = df1['x'] + df1['y']

z_observed = 950
df1.drop(df1[np.round(df1['z']) != z_observed].index, inplace = True)

hist1 = (pd.DataFrame(np.histogram(df1['mu'],bins=99,density=True))
            .transpose().rename(columns={0: 'L_mu', 1: 'mu'}))
hist1.plot(x='mu',y='L_mu')
Given:

$X \sim \mathcal{N}(\mu, \sigma^2)$
$Y|X=x \sim \mathcal{N}(0, (\theta x)^2)$
$Z = X + Y$

I want to be able to make hypothesis tests or confidence intervals for $\mu$ using $Z$ and known $\theta$ and $\sigma^2$. For example, I draw $z = 950$, and I have $\sigma^2 = 10000$ and $\theta = 0.10$. How would I estimate a confidence interval for $\mu$ with this information?

Edit:

I'm not really sure how to go about this analytically, but I've been able to create confidence intervals numerically. Here's an empirical plot of the likelihood of $\mu$ given the observed $z$ and parameters in the above example.

empirical likelihood plot

Code for the above plot:

import scipy.stats as stats
import numpy as np
import pandas as pd

x_var   = 10000
theta   = 0.10
samples = int(4e7)

df1       = pd.DataFrame(index=range(samples))
df1['mu'] = stats.uniform.rvs(size=samples)*1500+500
df1['x']  = stats.norm.rvs(loc=df1['mu'] , scale=np.sqrt(x_var)         , size=samples)
df1['y']  = stats.norm.rvs(loc=0         , scale=np.abs(theta*df1['x']) , size=samples)
df1['z']  = df1['x'] + df1['y']

z_observed = 950
df1.drop(df1[np.round(df1['z']) != z_observed].index, inplace = True)

hist1 = (pd.DataFrame(np.histogram(df1['mu'],bins=99,density=True))
            .transpose().rename(columns={0: 'L_mu', 1: 'mu'}))
hist1.plot(x='mu',y='L_mu')
updated text
Source Link

Given:

$X \sim \mathcal{N}(\mu, \sigma^2)$
$Y|X \sim \mathcal{N}(0, (\theta x)^2)$
$Z = X + Y$

I want to be able to make hypothesis tests or confidence intervals for $\mu$ using $Z$ and known $\theta$ and $\sigma^2$. For example, I draw $z = 950$, and I have $\sigma^2 = 10000$ and $\theta = 0.10$. How would I estimate a confidence interval for $\mu$ with this information?

Edit:

Here'sI'm not really sure how to go about this analytically, but I've been able to create confidence intervals numerically. Here's an empirical plot of the likelihood of $\mu$ given the observed $z$ and parameters in the above example.

empirical likelihood plotempirical likelihood plot

Code for the above plot:

import scipy.stats as stats
import numpy as np
import pandas as pd

x_var   = 10010000
theta   = 0.10
samples = int(5e74e7)

df1       = pd.DataFrame(index=range(samples))
df1['mu'] = stats.uniform.rvs(size=samples)*1500+500
df1['x']  = stats.norm.rvs(loc=df1['mu'] , scale=np.sqrt(x_var)         , size=samples)
df1['y']  = stats.norm.rvs(loc=0         , scale=np.abs(theta*df1['x']) , size=samples)
df1['z']  = df1['x'] + df1['y']

z_observed = 950
df1.drop(df1[np.round(df1['z']) != z_observed].index, inplace = True)

hist1 = (pd.DataFrame(np.histogram(df1['mu'],bins=199bins=99,density=True))
            .transpose().rename(columns={0: 'L_mu', 1: 'mu'}))
hist1.plot(x='mu',y='L_mu')

Given:

$X \sim \mathcal{N}(\mu, \sigma^2)$
$Y|X \sim \mathcal{N}(0, (\theta x)^2)$
$Z = X + Y$

I want to be able to make hypothesis tests or confidence intervals for $\mu$ using $Z$ and known $\theta$ and $\sigma^2$. For example, I draw $z = 950$, and I have $\sigma^2 = 10000$ and $\theta = 0.10$. How would I estimate a confidence interval for $\mu$ with this information?

Edit:

Here's an empirical plot of the likelihood of $\mu$ given the observed $z$ and parameters in the above example.

empirical likelihood plot

Code for the above plot:

import scipy.stats as stats
import numpy as np
import pandas as pd

x_var   = 100
theta   = 0.10
samples = int(5e7)

df1       = pd.DataFrame(index=range(samples))
df1['mu'] = stats.uniform.rvs(size=samples)*1500+500
df1['x']  = stats.norm.rvs(loc=df1['mu'] , scale=np.sqrt(x_var)         , size=samples)
df1['y']  = stats.norm.rvs(loc=0         , scale=np.abs(theta*df1['x']) , size=samples)
df1['z']  = df1['x'] + df1['y']

z_observed = 950
df1.drop(df1[np.round(df1['z']) != z_observed].index, inplace = True)

hist1 = (pd.DataFrame(np.histogram(df1['mu'],bins=199,density=True))
            .transpose().rename(columns={0: 'L_mu', 1: 'mu'}))
hist1.plot(x='mu',y='L_mu')

Given:

$X \sim \mathcal{N}(\mu, \sigma^2)$
$Y|X \sim \mathcal{N}(0, (\theta x)^2)$
$Z = X + Y$

I want to be able to make hypothesis tests or confidence intervals for $\mu$ using $Z$ and known $\theta$ and $\sigma^2$. For example, I draw $z = 950$, and I have $\sigma^2 = 10000$ and $\theta = 0.10$. How would I estimate a confidence interval for $\mu$ with this information?

Edit:

I'm not really sure how to go about this analytically, but I've been able to create confidence intervals numerically. Here's an empirical plot of the likelihood of $\mu$ given the observed $z$ and parameters in the above example.

empirical likelihood plot

Code for the above plot:

import scipy.stats as stats
import numpy as np
import pandas as pd

x_var   = 10000
theta   = 0.10
samples = int(4e7)

df1       = pd.DataFrame(index=range(samples))
df1['mu'] = stats.uniform.rvs(size=samples)*1500+500
df1['x']  = stats.norm.rvs(loc=df1['mu'] , scale=np.sqrt(x_var)         , size=samples)
df1['y']  = stats.norm.rvs(loc=0         , scale=np.abs(theta*df1['x']) , size=samples)
df1['z']  = df1['x'] + df1['y']

z_observed = 950
df1.drop(df1[np.round(df1['z']) != z_observed].index, inplace = True)

hist1 = (pd.DataFrame(np.histogram(df1['mu'],bins=99,density=True))
            .transpose().rename(columns={0: 'L_mu', 1: 'mu'}))
hist1.plot(x='mu',y='L_mu')
added 737 characters in body
Source Link

Given:

$X \sim \mathcal{N}(\mu, \sigma^2)$
$Y|X \sim \mathcal{N}(0, (\theta x)^2)$
$Z = X + Y$

I want to be able to make hypothesis tests or confidence intervals for $\mu$ using $Z$ and known $\theta$ and $\sigma^2$. For example, I draw $z = 950$, and I have $\sigma^2 = 10000$ and $\theta = 0.10$. How would I estimate a confidence interval for $\mu$ with this information?

Edit:

Here's an empirical plot of the likelihood of $\mu$ given the observed $z$ and parameters in the above example.

empirical likelihood plotempirical likelihood plot

Code for the above plot:

import scipy.stats as stats
import numpy as np
import pandas as pd

x_var   = 100
theta   = 0.10
samples = int(5e7)

df1       = pd.DataFrame(index=range(samples))
df1['mu'] = stats.uniform.rvs(size=samples)*1500+500
df1['x']  = stats.norm.rvs(loc=df1['mu'] , scale=np.sqrt(x_var)         , size=samples)
df1['y']  = stats.norm.rvs(loc=0         , scale=np.abs(theta*df1['x']) , size=samples)
df1['z']  = df1['x'] + df1['y']

z_observed = 950
df1.drop(df1[np.round(df1['z']) != z_observed].index, inplace = True)

hist1 = (pd.DataFrame(np.histogram(df1['mu'],bins=199,density=True))
            .transpose().rename(columns={0: 'L_mu', 1: 'mu'}))
hist1.plot(x='mu',y='L_mu')

Given:

$X \sim \mathcal{N}(\mu, \sigma^2)$
$Y|X \sim \mathcal{N}(0, (\theta x)^2)$
$Z = X + Y$

I want to be able to make hypothesis tests or confidence intervals for $\mu$ using $Z$ and known $\theta$ and $\sigma^2$. For example, I draw $z = 950$, and I have $\sigma^2 = 10000$ and $\theta = 0.10$. How would I estimate a confidence interval for $\mu$ with this information?

Edit:

Here's an empirical plot of the likelihood of $\mu$ given the observed $z$ and parameters in the above example.

empirical likelihood plot

Code for the above plot:

import scipy.stats as stats
import numpy as np
import pandas as pd

x_var   = 100
theta   = 0.10
samples = int(5e7)

df1       = pd.DataFrame(index=range(samples))
df1['mu'] = stats.uniform.rvs(size=samples)*1500+500
df1['x']  = stats.norm.rvs(loc=df1['mu'] , scale=np.sqrt(x_var)         , size=samples)
df1['y']  = stats.norm.rvs(loc=0         , scale=np.abs(theta*df1['x']) , size=samples)
df1['z']  = df1['x'] + df1['y']

z_observed = 950
df1.drop(df1[np.round(df1['z']) != z_observed].index, inplace = True)

hist1 = (pd.DataFrame(np.histogram(df1['mu'],bins=199,density=True))
            .transpose().rename(columns={0: 'L_mu', 1: 'mu'}))
hist1.plot(x='mu',y='L_mu')
Added an empirical likelihood plot.
Source Link
Loading
Fixed notation.
Source Link
Loading
edited title
Link
kjetil b halvorsen
  • 82.8k
  • 32
  • 201
  • 663
Loading
Removing an assumption that may not be vaild.
Source Link
Loading
deleted 14 characters in body
Source Link
kjetil b halvorsen
  • 82.8k
  • 32
  • 201
  • 663
Loading
Source Link
Loading