Post Closed as "Duplicate" by Dave, Stephan Kolassa, dipetkov
added 2 characters in body
Source Link

I want to run a binary logistic regression to understanding (modeling) factors affecting nest-site selection in a bird species.. I think it is better if I transform continuous variables to categorical variables, because for example Nest Height from the ground can have different effects in different ranges (different intervals); for example 0-200cm will have a negative effect in Nest-site selection while 200-250cm have a positive effect and it will be change in next ranges too + - - + + - + .. After running Binary logistic regression we will have a coefficient for each category instead of having a coefficient for a variable. I

I am looking for a method where the cut points are not exactly in the data. I think it will be about distribution and density.. I think Equal probability histogram with Kernel density estimation is a good method for this purpose particularly when I can run a Pairwise comparison of means to know each category built properly or not, but only when I do Visual interpretation.. I am looking for a more scientific method which I will refer to in my article. Thanks. enter image description here enter image description here
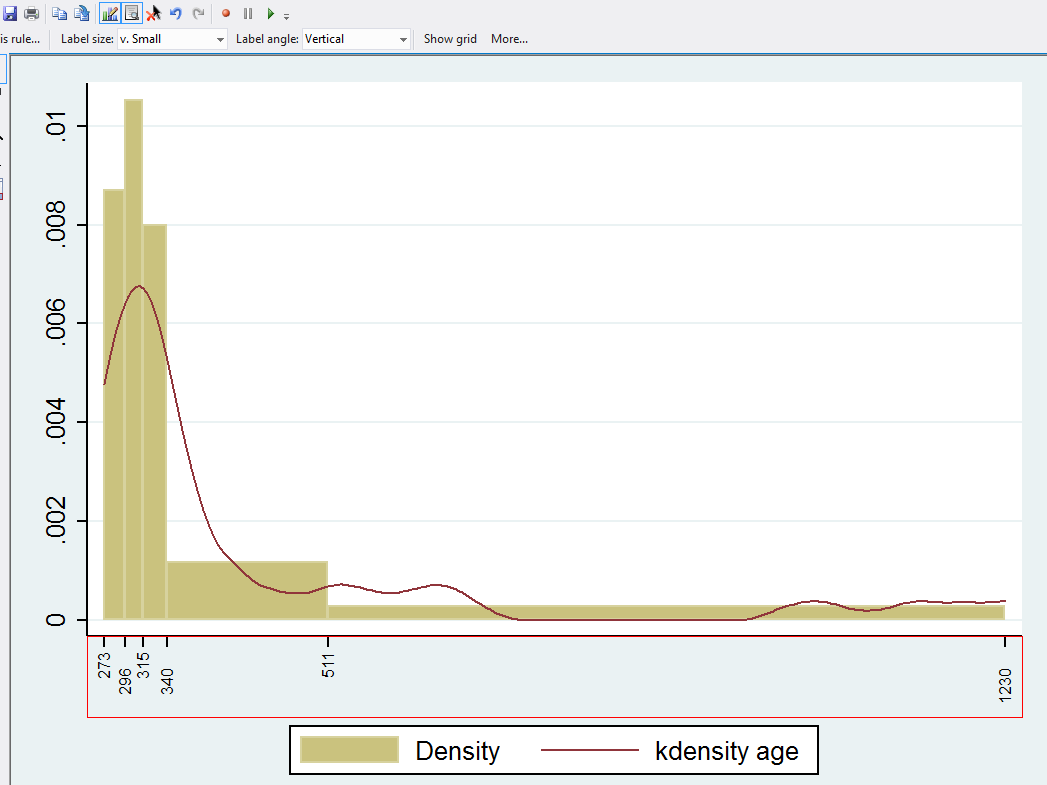
I want to run a binary logistic regression to understanding (modeling) factors affecting nest-site selection in a bird species.. I think it is better if I transform continuous variables to categorical variables, because for example Nest Height from the ground can have different effects in different ranges (different intervals); for example 0-200cm will have a negative effect in Nest-site selection while 200-250cm have a positive effect and it will be change in next ranges too + - - + + - + .. After running Binary logistic regression we will have a coefficient for each category instead of having a coefficient for a variable. I am looking for a method where the cut points are not exactly in the data. I think it will be about distribution and density.. I think Equal probability histogram with Kernel density estimation is a good method for this purpose particularly when I can run a Pairwise comparison of means to know each category built properly or not, but only when I do Visual interpretation.. I am looking for a more scientific method which I will refer to in my article. Thanks. enter image description here enter image description here
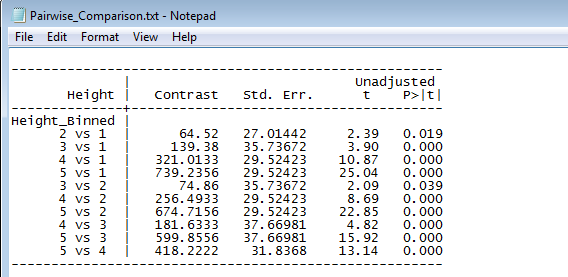
I want to run a binary logistic regression to understanding (modeling) factors affecting nest-site selection in a bird species.. I think it is better if I transform continuous variables to categorical variables, because for example Nest Height from the ground can have different effects in different ranges (different intervals); for example 0-200cm will have a negative effect in Nest-site selection while 200-250cm have a positive effect and it will be change in next ranges too + - - + + - + .. After running Binary logistic regression we will have a coefficient for each category instead of having a coefficient for a variable.

I am looking for a method where the cut points are not exactly in the data. I think it will be about distribution and density.. I think Equal probability histogram with Kernel density estimation is a good method for this purpose particularly when I can run a Pairwise comparison of means to know each category built properly or not, but only when I do Visual interpretation.. I am looking for a more scientific method which I will refer to in my article. Thanks. enter image description here enter image description here

Source Link

Binning continuous predictors, What is the best way?

I want to run a binary logistic regression to understanding (modeling) factors affecting nest-site selection in a bird species.. I think it is better if I transform continuous variables to categorical variables, because for example Nest Height from the ground can have different effects in different ranges (different intervals); for example 0-200cm will have a negative effect in Nest-site selection while 200-250cm have a positive effect and it will be change in next ranges too + - - + + - + .. After running Binary logistic regression we will have a coefficient for each category instead of having a coefficient for a variable. I am looking for a method where the cut points are not exactly in the data. I think it will be about distribution and density.. I think Equal probability histogram with Kernel density estimation is a good method for this purpose particularly when I can run a Pairwise comparison of means to know each category built properly or not, but only when I do Visual interpretation.. I am looking for a more scientific method which I will refer to in my article. Thanks. enter image description here enter image description here