added 351 characters in body
Source Link
COOLSerdash
  • 31.2k
  • 10
  • 104
  • 157

I am trying to perform a multiple regression in R. However, my dependent variable has the following plot:
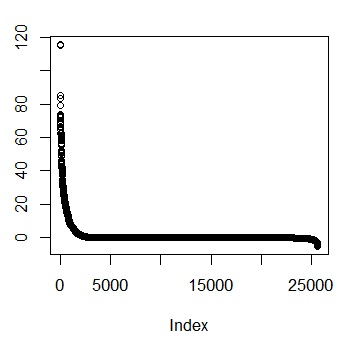
DV

Here is a scatterplot matrix with all my variables (WAR is the dependent variable):
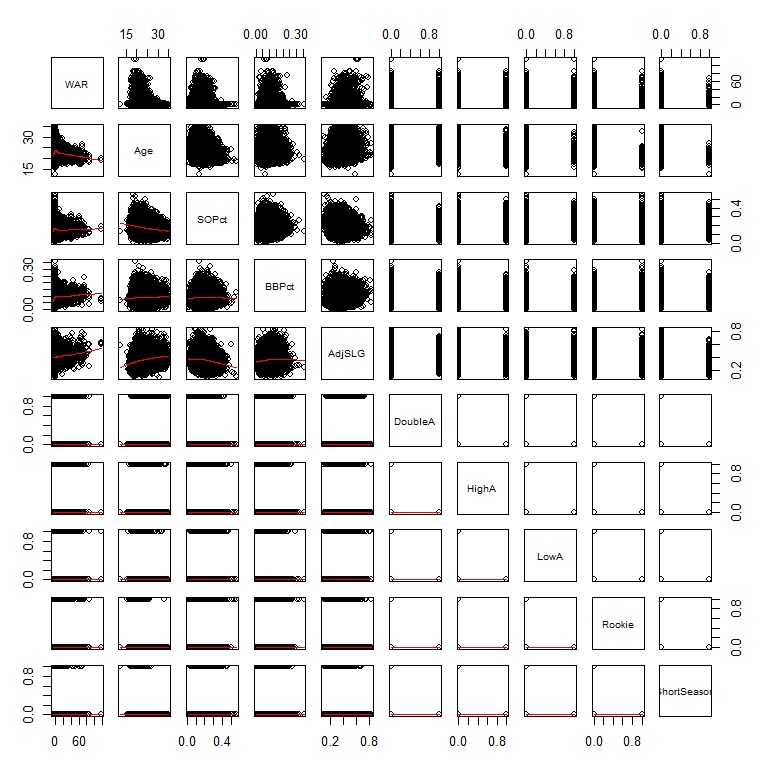
SPLOM

I know that I need to perform a transformation on this variable (and possibly the independent variables?) but I am not sure of the exact transformation required. Can someone point me in the right direction? I am happy to provide any additional information about the relationship between the independent and dependent variables.

The diagnostic graphics from my regression look as follows:
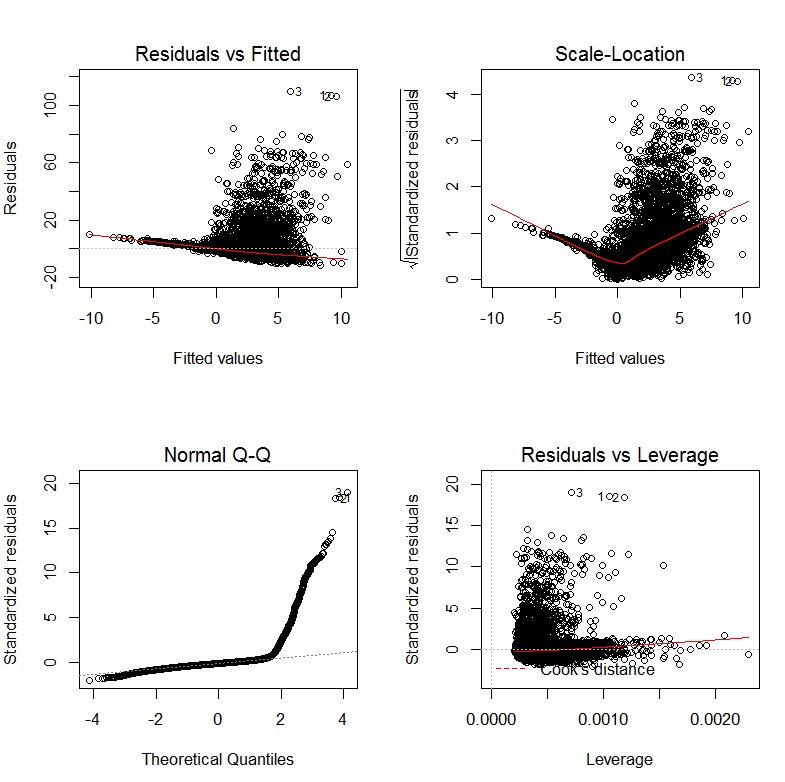
Diagnostic plots

EDIT

After transforming the dependent and independent variables using Yeo-Johnson transformations, the diagnostic plots look like this:
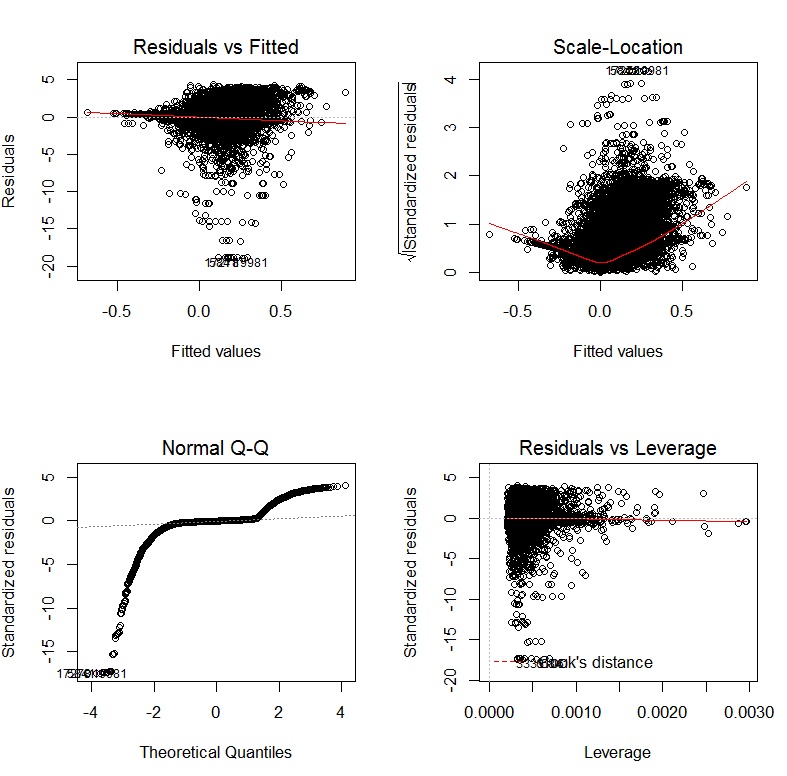
After transforming

If I use a GLM with a log-link, the diagnostic graphics are:
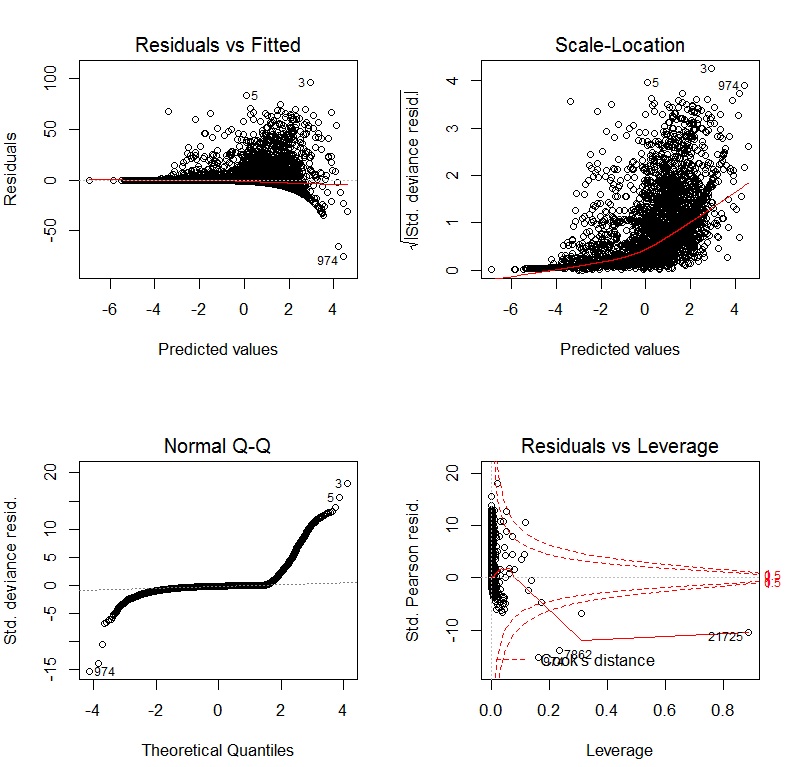
GLM with log-link

I am trying to perform a multiple regression in R. However, my dependent variable has the following plot:

DV

Here is a scatterplot matrix with all my variables (WAR is the dependent variable):

SPLOM

I know that I need to perform a transformation on this variable (and possibly the independent variables?) but I am not sure of the exact transformation required. Can someone point me in the right direction? I am happy to provide any additional information about the relationship between the independent and dependent variables.

The diagnostic graphics from my regression look as follows:

Diagnostic plots

EDIT

After transforming the dependent and independent variables using Yeo-Johnson transformations, the diagnostic plots look like this:

After transforming

If I use a GLM with a log-link, the diagnostic graphics are:

GLM with log-link

added 34 characters in body
Source Link
COOLSerdash
  • 31.2k
  • 10
  • 104
  • 157

I am trying to perform a multiple regression in R. However, my dependent variable has the following plot:

DV

Here is a scatterplot matrix with all my variables (WAR is the dependent variable):

SPLOM

I know that I need to perform a transformation on this variable (and possibly the independent variables?) but I am not sure of the exact transformation required. Can someone point me in the right direction? I am happy to provide any additional information about the relationship between the independent and dependent variables.

The diagnostic graphics from my regression look as follows:

Diagnostic plots

I am trying to perform a multiple regression in R. However, my dependent variable has the following plot:

DV

Here is a scatterplot matrix with all my variables:

SPLOM

I know that I need to perform a transformation on this variable (and possibly the independent variables?) but I am not sure of the exact transformation required. Can someone point me in the right direction? I am happy to provide any additional information about the relationship between the independent and dependent variables.

The diagnostic graphics from my regression look as follows:

Diagnostic plots

I am trying to perform a multiple regression in R. However, my dependent variable has the following plot:

DV

Here is a scatterplot matrix with all my variables (WAR is the dependent variable):

SPLOM

I know that I need to perform a transformation on this variable (and possibly the independent variables?) but I am not sure of the exact transformation required. Can someone point me in the right direction? I am happy to provide any additional information about the relationship between the independent and dependent variables.

The diagnostic graphics from my regression look as follows:

Diagnostic plots

Tweeted twitter.com/#!/StackStats/status/343366947339108354
added 113 characters in body
Source Link
COOLSerdash
  • 31.2k
  • 10
  • 104
  • 157

I am trying to perform a multiple regression in R. However, my dependent variable has the following plot:

DV

Here is a scatterplot matrix with all my variables:

SPLOM

I know that I need to perform a transformation on this variable (and possibly the independent variables?) but I am not sure of the exact transformation required. Can someone point me in the right direction? I am happy to provide any additional information about the relationship between the independent and dependent variables.

The diagnostic graphics from my regression look as follows:

Diagnostic plots

I am trying to perform a multiple regression in R. However, my dependent variable has the following plot:

DV

Here is a scatterplot matrix with all my variables:

SPLOM

I know that I need to perform a transformation on this variable (and possibly the independent variables?) but I am not sure of the exact transformation required. Can someone point me in the right direction? I am happy to provide any additional information about the relationship between the independent and dependent variables.

The diagnostic graphics from my regression look as follows:

Diagnostic plots

added 132 characters in body
Source Link
COOLSerdash
  • 31.2k
  • 10
  • 104
  • 157
Loading
added 12 characters in body
Source Link
COOLSerdash
  • 31.2k
  • 10
  • 104
  • 157
Loading
Source Link
zgall1
  • 869
  • 3
  • 13
  • 17
Loading