added 5 characters in body
Source Link
Dave
  • 67k
  • 7
  • 105
  • 305

I'm $100\%$ with Ben. I have seen an obsession with unbiased estimators in causal inference and not understood it. After all, we're drawing our causal inferences based on the parameters, and we use statistical inference to guess what the parameter values are. If we have an estimated value of the parameter that is off by a large amount (which can happen for an unbiased estimator with high variance, see the graph below), we might make an incorrect conclusion, perhaps even get the incorrect sign!

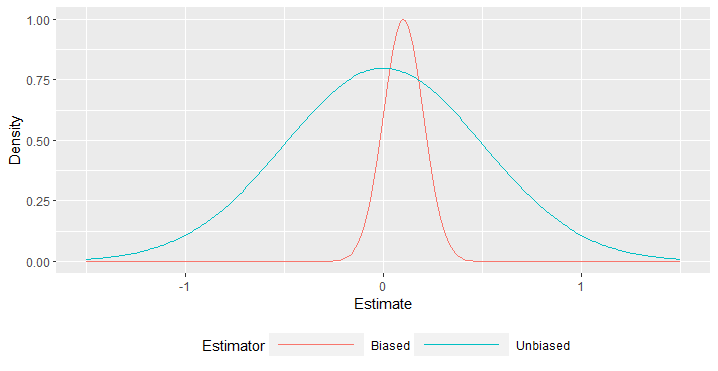
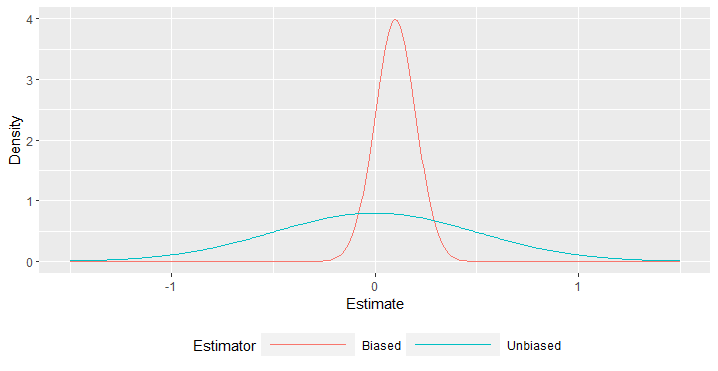
The sentiment almost seems to be that estimating using an unbiased estimator gives the true parameter value, and it simply does not, and the amount by which our estimated value is misses the true value could be considerable if we do not have a good control of the variance. A biased estimator can be off by a bit in expectation, sure, yet put us in position not to deviate very far from the true value. For a true parameter value of zero, consider the two densities below, one of which is the density of a possible unbiased estimator and the other of which is the density of a possible biased estimator with much lower variance and mean squared error. The unbiased estimator has so much higher of a probability of being far away from the true value!

Estimator densitiesEstimator densities

library(ggplot2)
set.seed(2023)
s <- seq(-1.5, 1.5, 0.01)
y1 <- dnorm(s, 0.1, 0.1)
y2 <- dnorm(s, 0, 0.5)
# y1 <- y1/max(y1, y2) # Uncomment these lines to scale the densities, as I first did
# y2 <- y2/max(y1, y2) # Uncomment these lines to scale the densities, as I first did
d1 <- data.frame(
  Estimate = s,
  Density = y1,
  Estimator = "Biased"
)
d2 <- data.frame(
  Estimate = s,
  Density = y2,
  Estimator = "Unbiased"
)
df_plot <- rbind(d1, d2)
ggplot(df_plot, aes(x = Estimate, y = Density, col = Estimator)) +
  geom_line() +
  theme(
    legend.position = "bottom",  
    legend.key.width = unit(2.5, "cm")
  )

I'm $100\%$ with Ben. I have seen an obsession with unbiased estimators in causal inference and not understood it. After all, we're drawing our causal inferences based on the parameters, and we use statistical inference to guess what the parameter values are. If we have an estimated value of the parameter that is off by a large amount (which can happen for an unbiased estimator with high variance, see the graph below), we might make an incorrect conclusion, perhaps even get the incorrect sign!

The sentiment almost seems to be that estimating using an unbiased estimator gives the true parameter value, and it simply does not, and the amount by which our estimated value is misses the true value could be considerable if we do not have a good control of the variance. A biased estimator can be off by a bit in expectation, sure, yet put us in position not to deviate very far from the true value. For a true parameter value of zero, consider the two densities below, one of which is the density of a possible unbiased estimator and the other of which is the density of a possible biased estimator with much lower variance and mean squared error. The unbiased estimator has so much higher of a probability of being far away from the true value!

Estimator densities

library(ggplot2)
set.seed(2023)
s <- seq(-1.5, 1.5, 0.01)
y1 <- dnorm(s, 0.1, 0.1)
y2 <- dnorm(s, 0, 0.5)
y1 <- y1/max(y1, y2)
y2 <- y2/max(y1, y2)
d1 <- data.frame(
  Estimate = s,
 Density = y1,
  Estimator = "Biased"
)
d2 <- data.frame(
  Estimate = s,
  Density = y2,
  Estimator = "Unbiased"
)
df_plot <- rbind(d1, d2)
ggplot(df_plot, aes(x = Estimate, y = Density, col = Estimator)) +
  geom_line() +
  theme(
    legend.position = "bottom",  
    legend.key.width = unit(2.5, "cm")
  )
I'm $100\%$ with Ben. I have seen an obsession with unbiased estimators in causal inference and not understood it. After all, we're drawing our causal inferences based on the parameters, and we use statistical inference to guess what the parameter values are. If we have an estimated value of the parameter that is off by a large amount (which can happen for an unbiased estimator with high variance, see the graph below), we might make an incorrect conclusion, perhaps even get the incorrect sign!

The sentiment almost seems to be that estimating using an unbiased estimator gives the true parameter value, and it simply does not, and the amount by which our estimated value is misses the true value could be considerable if we do not have a good control of the variance. A biased estimator can be off by a bit in expectation, sure, yet put us in position not to deviate very far from the true value. For a true parameter value of zero, consider the two densities below, one of which is the density of a possible unbiased estimator and the other of which is the density of a possible biased estimator with much lower variance and mean squared error. The unbiased estimator has so much higher of a probability of being far away from the true value!

Estimator densities

library(ggplot2)
set.seed(2023)
s <- seq(-1.5, 1.5, 0.01)
y1 <- dnorm(s, 0.1, 0.1)
y2 <- dnorm(s, 0, 0.5)
# y1 <- y1/max(y1, y2) # Uncomment these lines to scale the densities, as I first did
# y2 <- y2/max(y1, y2) # Uncomment these lines to scale the densities, as I first did
d1 <- data.frame(
  Estimate = s,
  Density = y1,
  Estimator = "Biased"
)
d2 <- data.frame(
  Estimate = s,
  Density = y2,
  Estimator = "Unbiased"
)
df_plot <- rbind(d1, d2)
ggplot(df_plot, aes(x = Estimate, y = Density, col = Estimator)) +
  geom_line() +
  theme(
    legend.position = "bottom",  
    legend.key.width = unit(2.5, "cm")
  )
Source Link
Dave
  • 67k
  • 7
  • 105
  • 305

I'm $100\%$ with Ben. I have seen an obsession with unbiased estimators in causal inference and not understood it. After all, we're drawing our causal inferences based on the parameters, and we use statistical inference to guess what the parameter values are. If we have an estimated value of the parameter that is off by a large amount (which can happen for an unbiased estimator with high variance, see the graph below), we might make an incorrect conclusion, perhaps even get the incorrect sign!

The sentiment almost seems to be that estimating using an unbiased estimator gives the true parameter value, and it simply does not, and the amount by which our estimated value is misses the true value could be considerable if we do not have a good control of the variance. A biased estimator can be off by a bit in expectation, sure, yet put us in position not to deviate very far from the true value. For a true parameter value of zero, consider the two densities below, one of which is the density of a possible unbiased estimator and the other of which is the density of a possible biased estimator with much lower variance and mean squared error. The unbiased estimator has so much higher of a probability of being far away from the true value!

Estimator densities

library(ggplot2)
set.seed(2023)
s <- seq(-1.5, 1.5, 0.01)
y1 <- dnorm(s, 0.1, 0.1)
y2 <- dnorm(s, 0, 0.5)
y1 <- y1/max(y1, y2)
y2 <- y2/max(y1, y2)
d1 <- data.frame(
  Estimate = s,
 Density = y1,
  Estimator = "Biased"
)
d2 <- data.frame(
  Estimate = s,
  Density = y2,
  Estimator = "Unbiased"
)
df_plot <- rbind(d1, d2)
ggplot(df_plot, aes(x = Estimate, y = Density, col = Estimator)) +
  geom_line() +
  theme(
    legend.position = "bottom",  
    legend.key.width = unit(2.5, "cm")
  )