Update (2024/08/10): I have added some additional points of consideration and citations to enhance the previous answer written here. Otherwise, the answer as a whole is essentially the same.
As Ben noted in the comments, there are no APA standards for reporting mixed models. However, there are certainly a good number of important parts about your analysis that should be included if this is for a published manuscript. A useful paper on this subject is Meteyard and Davies, 2020 (2020), which notes on Page 16 what you shouldincludes many of the points below. I have also updated this list to include some additional considerations, which I signify with a * sign:
- Software and version used.
- What data cleaning/wrangling was involved and whether or not your data meets the assumptions of mixed models.
- Fixed and random effects are explicitly noted with important theoretical underpinnings noted for how the model was constructed.
- Sample size in terms of units of observations (50 subjects x 10 items = 500 observations for crossed effects models).
- Whatever model comparison was employed and the metrics that go with that (such as AIC/BIC).
- Convergence issues and how they were handled.
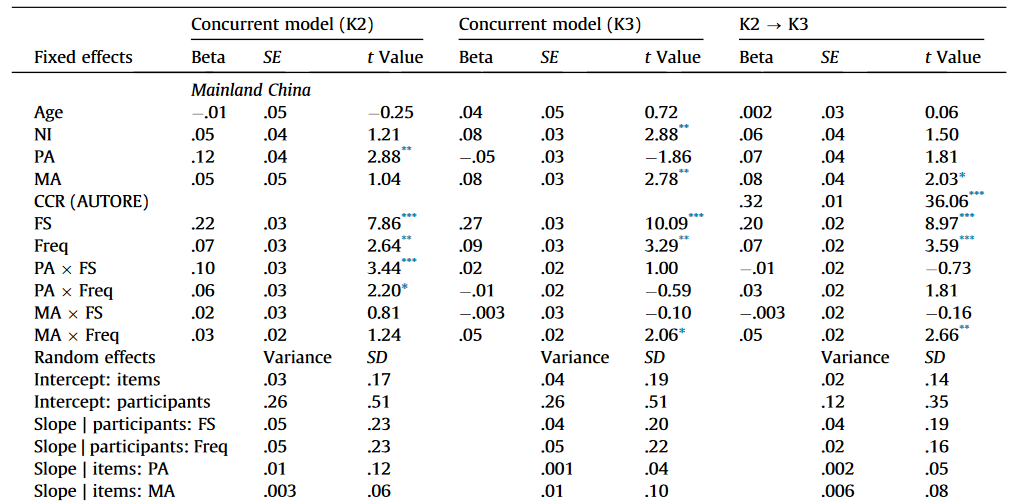
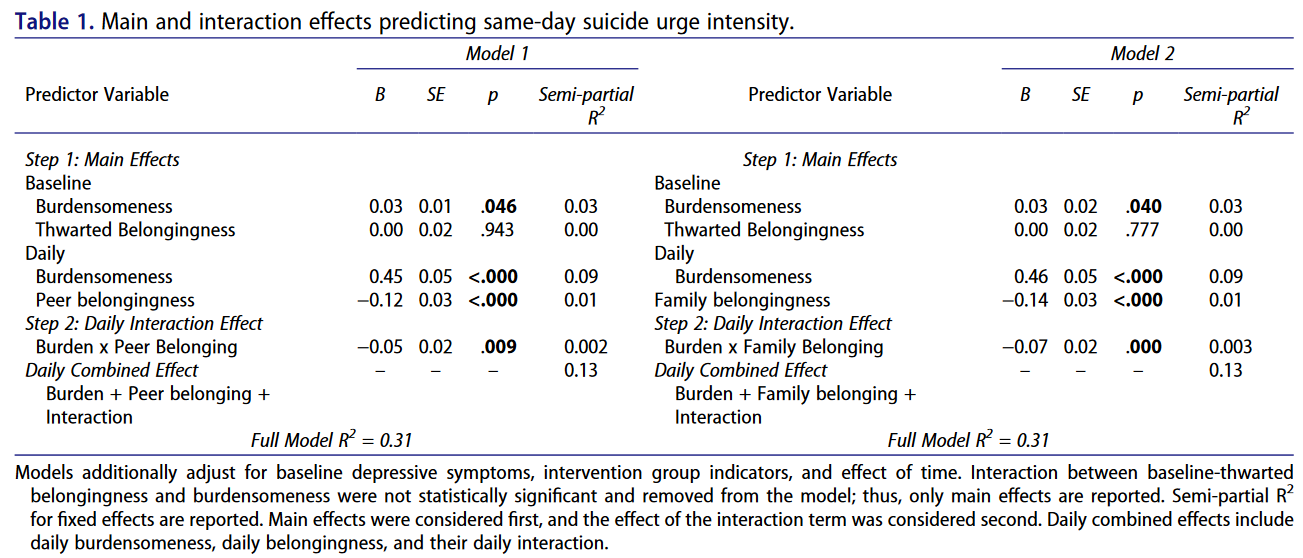
- The model equation and output (normally reported in a table), which includes pretty much everything it spits out (point estimates, standard errors, etc) as well as model fit metrics (pseudo R2 values for example).
- If possible, the data and code itself.
- The number of clusters and features of those clusters (e.g. how many observations per cluster) can be very useful to include, particularly given that we know clusters can have a sizeable impact on the results (Austin & Leckie, 2018; Clark, 2008).*
- Partial effect sizes for individual effects. These have become more common to report, such as part $R^2$ and $f^2$, along with the model pseudo $R^2$ values mentioned previously (Lorah et al., 2018; Nakagawa et al., 2017; Stoffel et al., 2021).*
- For a study which analyzed original data using a frequentist paradigm, it is essential to also include a power analysis (see Kumle et al. 2021 and Kain et al. 2015 for how to do this). A Bayesian version may include a ROPE instead (Kruschke & Liddell, 2018).*
- Visualizing the results. The Meteyard & Davies article shows some visualizations of mixed modeling (though this isn't an exhaustive or always typical list of plots). I would argue this part of reporting is one of the most essential, as taking one's word for it from a table alone isn't sufficient (particularly for seeing if a model is very misfit). Since many mixed models are fit with R, the sjPlot package is a great tool if you want a simple method for visualizing the results.*
Al-Dajani, N., & Czyz, E. K. (2022). Suicidal desire in adolescents: An examination of the interpersonal psychological theory using daily diaries. Journal of Clinical Child & Adolescent Psychology. https://doi.org/10.1080/15374416.2022.2051525
Wang, L., Wang, J., Liu, D., & Lin, D. (2021). The role of metalinguistic awareness and character properties in early Chinese reading. Journal of Experimental Child Psychology, 210, 105185. https://doi.org/10.1016/j.jecp.2021.105185
Papers on Power/ROPE
- Kain, M. P., Bolker, B. M., & McCoy, M. W. (2015). A practical guide and power analysis for GLMMs: Detecting among treatment variation in random effects. PeerJ, 3, e1226. https://doi.org/10.7717/peerj.1226
- Kumle, L., Võ, M. L.-H., & Draschkow, D. (2021). Estimating power in (generalized) linear mixed models: An open introduction and tutorial in R. Behavior Research Methods, 53, 2528–2543. https://doi.org/10.3758/s13428-021-01546-0
- Kruschke, J. K., & Liddell, T. M. (2018). The Bayesian new statistics: Hypothesis testing, estimation, meta-analysis, and power analysis from a Bayesian perspective. Psychonomic Bulletin & Review, 25(1), 178–206. https://doi.org/10.3758/s13423-016-1221-4
Papers on Effect Sizes in Mixed Models
- Lorah, J. (2018). Effect size measures for multilevel models: Definition, interpretation, and TIMSS example. Large-Scale Assessments in Education, 6(1), 8. https://doi.org/10.1186/s40536-018-0061-2
- Nakagawa, S., Johnson, P. C. D., & Schielzeth, H. (2017). The coefficient of determination R2 and intra-class correlation coefficient from generalized linear mixed-effects models revisited and expanded. Journal of the Royal Society, 14. https://doi.org/10.1098/rsif.2017.0213
- Stoffel, M. A., Nakagawa, S., & Schielzeth, H. (2021). partR2: Partitioning R2 in generalized linear mixed models. PeerJ, 9, e11414. https://doi.org/10.7717/peerj.11414
Papers on Cluster Effects
- Austin, P. C., & Leckie, G. (2018). The effect of number of clusters and cluster size on statistical power and Type I error rates when testing random effects variance components in multilevel linear and logistic regression models. Journal of Statistical Computation and Simulation, 88(16), 3151–3163. https://doi.org/10.1080/00949655.2018.1504945
- Clarke, P. (2008). When can group level clustering be ignored? Multilevel models versus single-level models with sparse data. Journal of Epidemiology & Community Health, 62(8), 752–758. https://doi.org/10.1136/jech.2007.060798


