Jeopardy compliance. Fixed the question formation - see e.g. <https://www.youtube.com/watch?v=t4yWEt0OSpg&t=1m49s> (see also <https://www.youtube.com/watch?v=kS5NfSzXfrI> (QUASM)). Removed meta information (this belongs in comments and/or is implied by posting here).
Source Link

Why doesn't estimating Shannon entropy with a histogram doesn't converge to its true value?

I'm following the third recipe of this answer to estimate the Shannon entropy of my samples using histograms. My expectation was, increasing the sample size should lead to a better estimation of the true entropy. To test that, I sampled from a Gaussian distribution $N(0, \sigma^2)$ with known entropy $H(X) = 0.5[1 + \log(2\pi \sigma^2)]$:

import numpy as np
from scipy.stats import entropy # by default in natural log
import matplotlib.pyplot as plt

sigma = 2
H0 = 0.5*(1 + np.log(2*np.pi*sigma**2)) # theoretical value in nats

Hs = []
ns = np.logspace(2,6,5, dtype=int)
for n in ns:
    X = np.random.normal(0, sigma, size=n)
    nbins = int(n/20)  # <--- This is causes divergence, read UPDATE 2
    hist, bin_edges = np.histogram(X, nbins, density=True)
    Hs.append(entropy(hist)) # will be automatically normalized to sum to 1

plt.plot(ns, Hs, '-x', label='estimation')
plt.hlines(H0, ns[0], ns[-1], linestyle='--', color='k', label='exact H') 
plt.legend()
plt.yticks(np.arange(11))
plt.xscale('log')
plt.xlabel('num samples')
plt.ylabel('sample entropy')

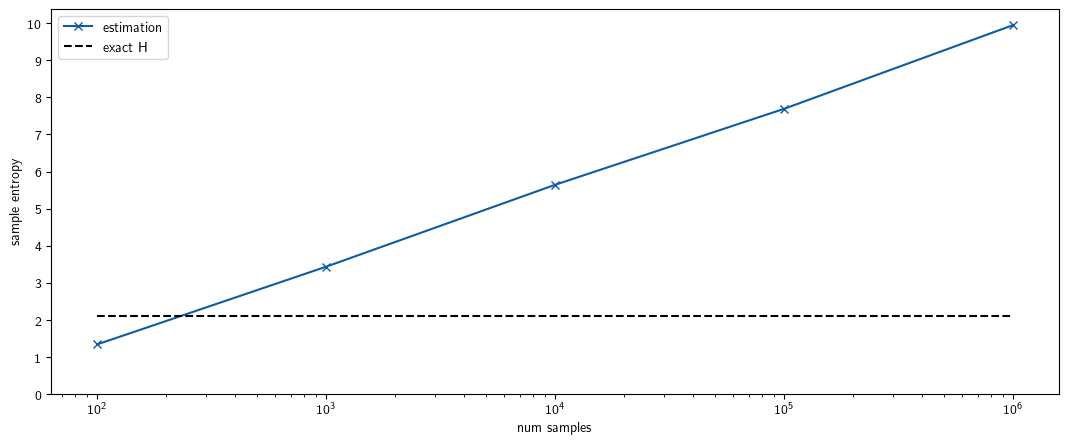
To my surprise, they diverge:

enter image description hereEnter image description here

Am I bet I'm missing something very simple but unfortunately, cannot spot it. Any help is appreciated.?

UPDATE

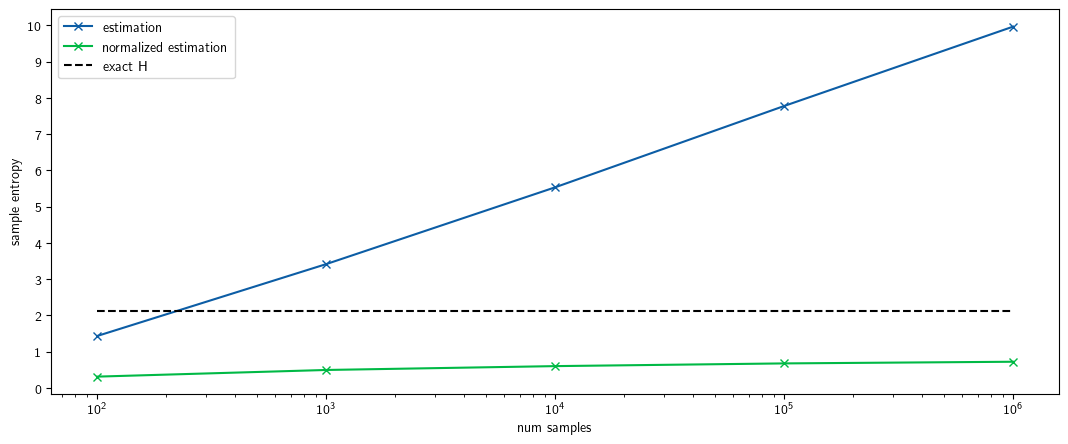
I found a relevant question that is concerned about the case where the probability distribution is either "peaked" or "flat". The upshot of the most voted answer is that one has to normalize the entropy by $\log n$ where $n$ is the number of samples. Although I find this normalization sensible, I still observe an offset between the theoretical value and the estimation:

plt.plot(ns, np.array(Hs)/np.log(ns), '-x', label='normalized estimation') # normalized

enter image description here

What causes this discrepancy?

UPDATE 2

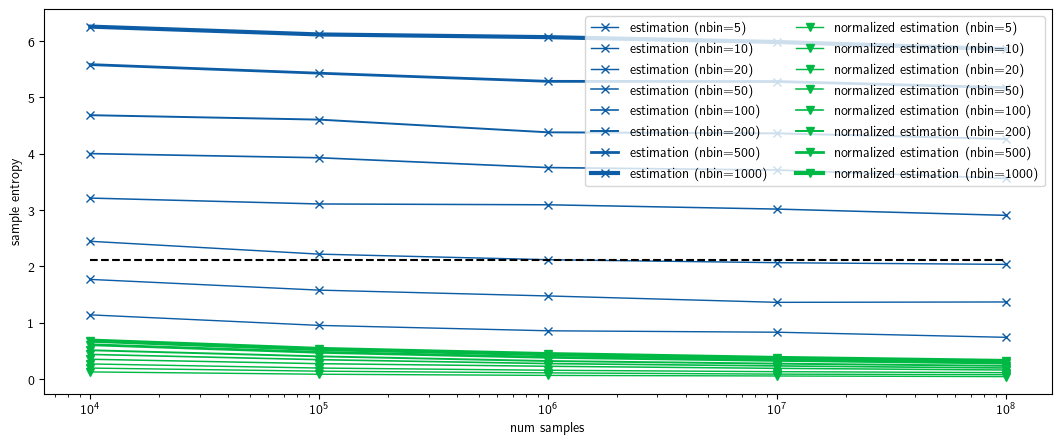
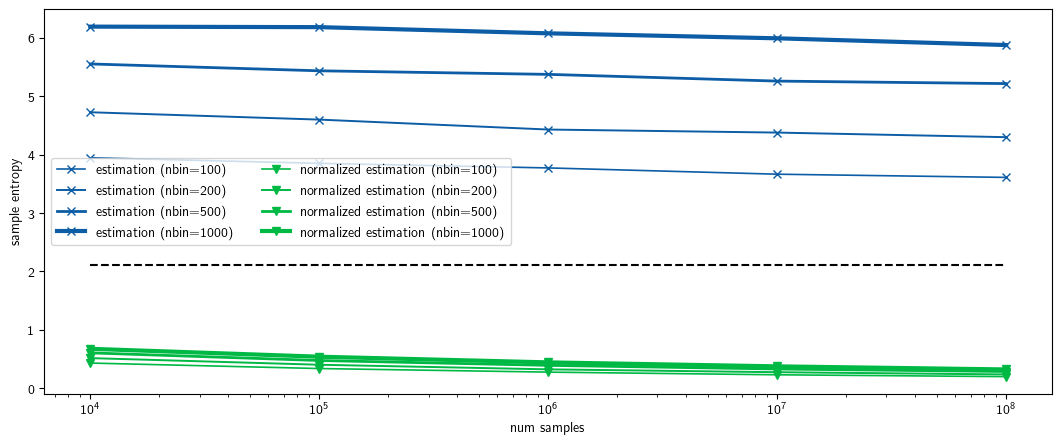
As @sextus-empiricus noted below, scaling the number bins with the sample size leads to a coarse density estimation. In fact, fixing the number of bins, resolves the divergence. However, no matter what number of bins one chooses, there's still some offset between the estimated (normalized or non-normalized) entropy and the theoretical value, as you can see below:

enter image description hereEnter image description here

I appreciate it if someone can explainWhat is the reason behind this gap as well.? The curve displacement by nbins clearly suggest that there's a relationship between the two, but I found the reason elusive.

Why estimating Shannon entropy with histogram doesn't converge to its true value?

I'm following the third recipe of this answer to estimate the Shannon entropy of my samples using histograms. My expectation was, increasing the sample size should lead to a better estimation of the true entropy. To test that, I sampled from a Gaussian distribution $N(0, \sigma^2)$ with known entropy $H(X) = 0.5[1 + \log(2\pi \sigma^2)]$:

import numpy as np
from scipy.stats import entropy # by default in natural log
import matplotlib.pyplot as plt

sigma = 2
H0 = 0.5*(1 + np.log(2*np.pi*sigma**2)) # theoretical value in nats

Hs = []
ns = np.logspace(2,6,5, dtype=int)
for n in ns:
    X = np.random.normal(0, sigma, size=n)
    nbins = int(n/20)  # <--- This is causes divergence, read UPDATE 2
    hist, bin_edges = np.histogram(X, nbins, density=True)
    Hs.append(entropy(hist)) # will be automatically normalized to sum to 1

plt.plot(ns, Hs, '-x', label='estimation')
plt.hlines(H0, ns[0], ns[-1], linestyle='--', color='k', label='exact H') 
plt.legend()
plt.yticks(np.arange(11))
plt.xscale('log')
plt.xlabel('num samples')
plt.ylabel('sample entropy')

To my surprise, they diverge:

enter image description here

I bet I'm missing something very simple but unfortunately, cannot spot it. Any help is appreciated.

UPDATE

I found a relevant question that is concerned about the case where the probability distribution is either "peaked" or "flat". The upshot of the most voted answer is that one has to normalize the entropy by $\log n$ where $n$ is the number of samples. Although I find this normalization sensible, I still observe an offset between the theoretical value and the estimation:

plt.plot(ns, np.array(Hs)/np.log(ns), '-x', label='normalized estimation') # normalized

enter image description here

What causes this discrepancy?

UPDATE 2

As @sextus-empiricus noted below, scaling the number bins with the sample size leads to a coarse density estimation. In fact, fixing the number of bins, resolves the divergence. However, no matter what number of bins one chooses, there's still some offset between the estimated (normalized or non-normalized) entropy and the theoretical value, as you can see below:

enter image description here

I appreciate it if someone can explain the reason behind this gap as well. The curve displacement by nbins clearly suggest that there's a relationship between the two, but I found the reason elusive.
Why doesn't estimating Shannon entropy with a histogram converge to its true value?

I'm following the third recipe of this answer to estimate the Shannon entropy of my samples using histograms. My expectation was, increasing the sample size should lead to a better estimation of the true entropy. To test that, I sampled from a Gaussian distribution $N(0, \sigma^2)$ with known entropy $H(X) = 0.5[1 + \log(2\pi \sigma^2)]$:

import numpy as np
from scipy.stats import entropy # by default in natural log
import matplotlib.pyplot as plt

sigma = 2
H0 = 0.5*(1 + np.log(2*np.pi*sigma**2)) # theoretical value in nats

Hs = []
ns = np.logspace(2,6,5, dtype=int)
for n in ns:
    X = np.random.normal(0, sigma, size=n)
    nbins = int(n/20)  # <--- This is causes divergence, read UPDATE 2
    hist, bin_edges = np.histogram(X, nbins, density=True)
    Hs.append(entropy(hist)) # will be automatically normalized to sum to 1

plt.plot(ns, Hs, '-x', label='estimation')
plt.hlines(H0, ns[0], ns[-1], linestyle='--', color='k', label='exact H')
plt.legend()
plt.yticks(np.arange(11))
plt.xscale('log')
plt.xlabel('num samples')
plt.ylabel('sample entropy')

To my surprise, they diverge:

Enter image description here

Am I missing something very simple?

I found a relevant question that is concerned about the case where the probability distribution is either "peaked" or "flat". The upshot of the most voted answer is that one has to normalize the entropy by $\log n$ where $n$ is the number of samples. Although I find this normalization sensible, I still observe an offset between the theoretical value and the estimation:

plt.plot(ns, np.array(Hs)/np.log(ns), '-x', label='normalized estimation') # normalized

enter image description here

What causes this discrepancy?

As @sextus-empiricus noted below, scaling the number bins with the sample size leads to a coarse density estimation. In fact, fixing the number of bins, resolves the divergence. However, no matter what number of bins one chooses, there's still some offset between the estimated (normalized or non-normalized) entropy and the theoretical value, as you can see below:

Enter image description here

What is the reason behind this gap? The curve displacement by nbins clearly suggest that there's a relationship between the two, but I found the reason elusive.
Became Hot Network Question
enhancing title
Link
arash
  • 319
  • 1
  • 7

Why estimating Shannon entropy with histogram doesn't converge to its true value?

added 128 characters in body
Source Link
arash
  • 319
  • 1
  • 7

I'm following the third recipe of this answer to estimate the Shannon entropy of my samples using histograms. My expectation was, increasing the sample size should lead to a better estimation of the true entropy. To test that, I sampled from a Gaussian distribution $N(0, \sigma^2)$ with known entropy $H(X) = 0.5[1 + \log(2\pi \sigma^2)]$:

import numpy as np
from scipy.stats import entropy # by default in natural log
import matplotlib.pyplot as plt

sigma = 2
H0 = 0.5*(1 + np.log(2*np.pi*sigma**2)) # theoretical value in nats

Hs = []
ns = np.logspace(2,6,5, dtype=int)
for n in ns:
    X = np.random.normal(0, sigma, size=n)
    nbins = int(n/20)  # <--- This is causes divergence, read UPDATE 2
    hist, bin_edges = np.histogram(X, nbins, density=True)
    Hs.append(entropy(hist)) # will be automatically normalized to sum to 1

plt.plot(ns, Hs, '-x', label='estimation')
plt.hlines(H0, ns[0], ns[-1], linestyle='--', color='k', label='exact H') 
plt.legend()
plt.yticks(np.arange(11))
plt.xscale('log')
plt.xlabel('num samples')
plt.ylabel('sample entropy')

To my surprise, they diverge:

enter image description here

I bet I'm missing something very simple but unfortunately, cannot spot it. Any help is appreciated.

UPDATE

I found a relevant question that is concerned about the case where the probability distribution is either "peaked" or "flat". The upshot of the most voted answer is that one has to normalize the entropy by $\log n$ where $n$ is the number of samples. Although I find this normalization sensible, I still observe an offset between the theoretical value and the estimation:

plt.plot(ns, np.array(Hs)/np.log(ns), '-x', label='normalized estimation') # normalized

enter image description here

What causes this discrepancy?

UPDATE 2

As @sextus-empiricus noted below, scaling the number bins with the sample size leads to a coarse density estimation. In fact, fixing the number of bins, resolves the divergence. However, no matter what number of bins one chooses, there's still some offset between the estimated (normalized or non-normalized) entropy and the theoretical value, as you can see below:

enter image description hereenter image description here

I appreciate it if someone can explain the reason behind this gap as well. The curve displacement by nbins clearly suggest that there's a relationship between the two, but I found the reason elusive.
I'm following the third recipe of this answer to estimate the Shannon entropy of my samples using histograms. My expectation was, increasing the sample size should lead to a better estimation of the true entropy. To test that, I sampled from a Gaussian distribution $N(0, \sigma^2)$ with known entropy $H(X) = 0.5[1 + \log(2\pi \sigma^2)]$:

import numpy as np
from scipy.stats import entropy # by default in natural log
import matplotlib.pyplot as plt

sigma = 2
H0 = 0.5*(1 + np.log(2*np.pi*sigma**2)) # theoretical value in nats

Hs = []
ns = np.logspace(2,6,5, dtype=int)
for n in ns:
    X = np.random.normal(0, sigma, size=n)
    nbins = int(n/20)  # <--- This is causes divergence, read UPDATE 2
    hist, bin_edges = np.histogram(X, nbins, density=True)
    Hs.append(entropy(hist)) # will be automatically normalized to sum to 1

plt.plot(ns, Hs, '-x', label='estimation')
plt.hlines(H0, ns[0], ns[-1], linestyle='--', color='k', label='exact H') 
plt.legend()
plt.yticks(np.arange(11))
plt.xscale('log')
plt.xlabel('num samples')
plt.ylabel('sample entropy')

To my surprise, they diverge:

enter image description here

I bet I'm missing something very simple but unfortunately, cannot spot it. Any help is appreciated.

UPDATE

I found a relevant question that is concerned about the case where the probability distribution is either "peaked" or "flat". The upshot of the most voted answer is that one has to normalize the entropy by $\log n$ where $n$ is the number of samples. Although I find this normalization sensible, I still observe an offset between the theoretical value and the estimation:

plt.plot(ns, np.array(Hs)/np.log(ns), '-x', label='normalized estimation') # normalized

enter image description here

What causes this discrepancy?

UPDATE 2

As @sextus-empiricus noted below, scaling the number bins with the sample size leads to a coarse density estimation. In fact, fixing the number of bins, resolves the divergence. However, no matter what number of bins one chooses, there's still some offset between the estimated (normalized or non-normalized) entropy and the theoretical value, as you can see below:

enter image description here

I appreciate it if someone can explain the reason behind this gap as well.

I'm following the third recipe of this answer to estimate the Shannon entropy of my samples using histograms. My expectation was, increasing the sample size should lead to a better estimation of the true entropy. To test that, I sampled from a Gaussian distribution $N(0, \sigma^2)$ with known entropy $H(X) = 0.5[1 + \log(2\pi \sigma^2)]$:

import numpy as np
from scipy.stats import entropy # by default in natural log
import matplotlib.pyplot as plt

sigma = 2
H0 = 0.5*(1 + np.log(2*np.pi*sigma**2)) # theoretical value in nats

Hs = []
ns = np.logspace(2,6,5, dtype=int)
for n in ns:
    X = np.random.normal(0, sigma, size=n)
    nbins = int(n/20)  # <--- This is causes divergence, read UPDATE 2
    hist, bin_edges = np.histogram(X, nbins, density=True)
    Hs.append(entropy(hist)) # will be automatically normalized to sum to 1

plt.plot(ns, Hs, '-x', label='estimation')
plt.hlines(H0, ns[0], ns[-1], linestyle='--', color='k', label='exact H') 
plt.legend()
plt.yticks(np.arange(11))
plt.xscale('log')
plt.xlabel('num samples')
plt.ylabel('sample entropy')

To my surprise, they diverge:

enter image description here

I bet I'm missing something very simple but unfortunately, cannot spot it. Any help is appreciated.

UPDATE

I found a relevant question that is concerned about the case where the probability distribution is either "peaked" or "flat". The upshot of the most voted answer is that one has to normalize the entropy by $\log n$ where $n$ is the number of samples. Although I find this normalization sensible, I still observe an offset between the theoretical value and the estimation:

plt.plot(ns, np.array(Hs)/np.log(ns), '-x', label='normalized estimation') # normalized

enter image description here

What causes this discrepancy?

UPDATE 2

As @sextus-empiricus noted below, scaling the number bins with the sample size leads to a coarse density estimation. In fact, fixing the number of bins, resolves the divergence. However, no matter what number of bins one chooses, there's still some offset between the estimated (normalized or non-normalized) entropy and the theoretical value, as you can see below:

enter image description here

I appreciate it if someone can explain the reason behind this gap as well. The curve displacement by nbins clearly suggest that there's a relationship between the two, but I found the reason elusive.

added 599 characters in body
Source Link
arash
  • 319
  • 1
  • 7
Loading
Update: plotted normalized entropy
Source Link
arash
  • 319
  • 1
  • 7
Loading
another script showing the same issue
Source Link
arash
  • 319
  • 1
  • 7
Loading
edited title
Link
arash
  • 319
  • 1
  • 7
Loading
Source Link
arash
  • 319
  • 1
  • 7
Loading