edited title
Link
Gala
  • 8.6k
  • 2
  • 32
  • 44

Mann-Whitney or t test-test to compare age and expenditure after clustering

added 372 characters in body
Source Link
Cesare Camestre
  • 719
  • 4
  • 17
  • 28

I have carried out cluster analysis and now want to compare means between variables in different clusters. The variables in question are age and expenditure in millions of dollars.

The age variable does not follow a normal distribution: as a result, I was considering a Mann-Whitney test. The expenditure in millions of dollars fails the assumption of equality of variances.

Having stated this, although all tests seem to suggest that age does not follow normal distribution, I am not quite sure about the extent of this.
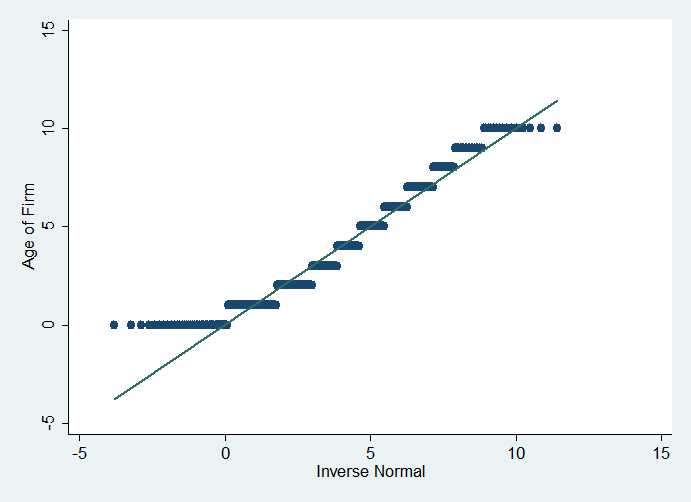
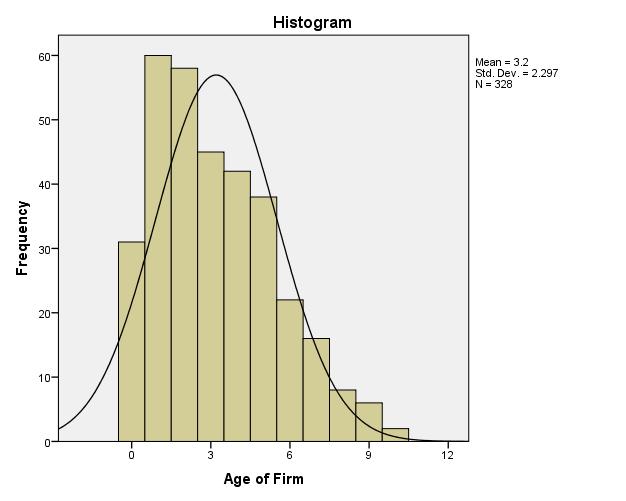
QNorm plot for ageHistogram Age Cluster 1

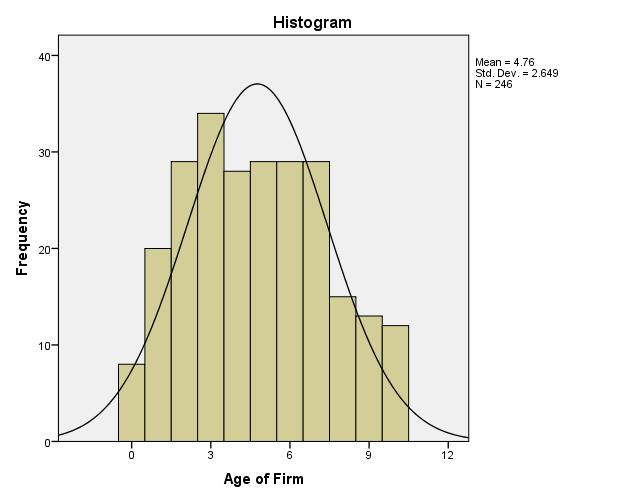
Histogram of age in cluster 1

Histogram Age Cluster 2

Histogram of Age in Cluster 2

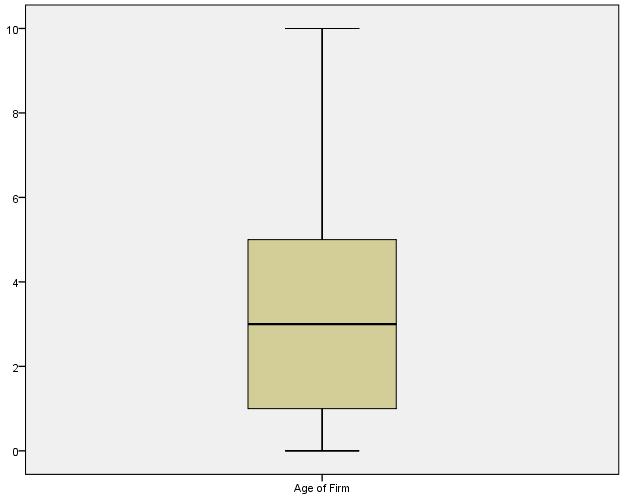
Box plot of age in cluster 1

Box plot of Age in Cluster 1

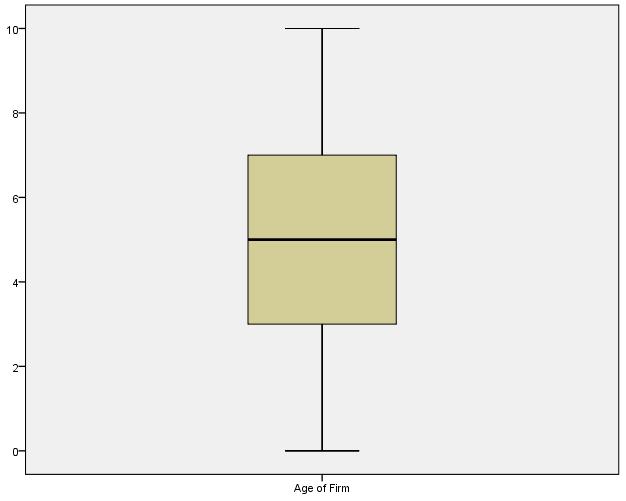
Box Plot - Age - Cluster 2

Box Plot of Age in Cluster 2

It has been suggested to use the Mann-Whitney test in this case, given that the assumption of normality is "not met".

  1. Does Mann Whitney work fine with continuous data? This link seems to suggest it does. Would SPSS automatically convert these into ranks?
  2. Zimmerman argues that t-test should work fine because it is scarcely affected by non-normality of the population!
  3. Sheskin (2007) suggests using a t-test anyway but using a more conservative approach (e.g critical values of t(0.01) instead of t(0.05).

How can I resolve this problem?

I have carried out cluster analysis and now want to compare means between variables in different clusters. The variables in question are age and expenditure in millions of dollars.

The age variable does not follow a normal distribution: as a result, I was considering a Mann-Whitney test. The expenditure in millions of dollars fails the assumption of equality of variances.

Having stated this, although all tests seem to suggest that age does not follow normal distribution, I am not quite sure about the extent of this.

QNorm plot for age

It has been suggested to use the Mann-Whitney test in this case, given that the assumption of normality is "not met".

  1. Does Mann Whitney work fine with continuous data? This link seems to suggest it does. Would SPSS automatically convert these into ranks?
  2. Zimmerman argues that t-test should work fine because it is scarcely affected by non-normality of the population!
  3. Sheskin (2007) suggests using a t-test anyway but using a more conservative approach (e.g critical values of t(0.01) instead of t(0.05).

How can I resolve this problem?

I have carried out cluster analysis and now want to compare means between variables in different clusters. The variables in question are age and expenditure in millions of dollars.

The age variable does not follow a normal distribution: as a result, I was considering a Mann-Whitney test. The expenditure in millions of dollars fails the assumption of equality of variances.

Having stated this, although all tests seem to suggest that age does not follow normal distribution, I am not quite sure about the extent of this.

Histogram Age Cluster 1

Histogram of age in cluster 1

Histogram Age Cluster 2

Histogram of Age in Cluster 2

Box plot of age in cluster 1

Box plot of Age in Cluster 1

Box Plot - Age - Cluster 2

Box Plot of Age in Cluster 2

It has been suggested to use the Mann-Whitney test in this case, given that the assumption of normality is "not met".

  1. Does Mann Whitney work fine with continuous data? This link seems to suggest it does. Would SPSS automatically convert these into ranks?
  2. Zimmerman argues that t-test should work fine because it is scarcely affected by non-normality of the population!
  3. Sheskin (2007) suggests using a t-test anyway but using a more conservative approach (e.g critical values of t(0.01) instead of t(0.05).

How can I resolve this problem?

added 160 characters in body
Source Link
COOLSerdash
  • 31.2k
  • 10
  • 104
  • 157

I have carried out cluster analysis and now want to compare means between variables in different clusters. The variables in question are age and expenditure in millions of dollars.

The age variable does not follow a normal distribution: as a result, I was considering use of thea Mann-Whitney test. TheThe expenditure in millions of dollars fails the assumption of equality of variances.

Having stated this, although all tests seem to suggest that age does not follow normal distribution, I am not quite sure about the extent of this.

QNorm plot for age

It has been suggested to use the Mann-Whitney test in this case, given that the assumption of normality is "not met".

  1. Does Mann Whitney work fine with continuous data? This link seems to suggest it does. Would SPSS automatically convert these into ranks?
  2. Zimmerman argues that t-test should work fine because it osis scarcely affected by non normality-normality of the population!
  3. Sheskin (2007)Sheskin (2007) suggests using a t-test anyway but using a more conservative approach (e.g critical values of t(0.01) instead of t(0.05).

How can I resolve this problem?

I have carried out cluster analysis and now want to compare means between variables in different clusters. The variables in question are age and expenditure in millions of dollars.

The age variable does not follow a normal distribution: as a result I was considering use of the Mann-Whitney test. The expenditure in millions of dollars fails the assumption of equality of variances.

Having stated this, although all tests seem to suggest that age does not follow normal distribution, I am not quite sure about the extent of this.

QNorm plot for age

It has been suggested to use the Mann-Whitney test in this case, given that the assumption of normality is "not met".

  1. Does Mann Whitney work fine with continuous data? This link seems to suggest it does. Would SPSS automatically convert these into ranks?
  2. Zimmerman argues that t-test should work fine because it os scarcely affected by non normality of the population!
  3. Sheskin (2007) suggests using a t-test anyway but using a more conservative approach (e.g critical values of t(0.01) instead of t(0.05).

How can I resolve this problem?

I have carried out cluster analysis and now want to compare means between variables in different clusters. The variables in question are age and expenditure in millions of dollars.

The age variable does not follow a normal distribution: as a result, I was considering a Mann-Whitney test. The expenditure in millions of dollars fails the assumption of equality of variances.

Having stated this, although all tests seem to suggest that age does not follow normal distribution, I am not quite sure about the extent of this.

QNorm plot for age

It has been suggested to use the Mann-Whitney test in this case, given that the assumption of normality is "not met".

  1. Does Mann Whitney work fine with continuous data? This link seems to suggest it does. Would SPSS automatically convert these into ranks?
  2. Zimmerman argues that t-test should work fine because it is scarcely affected by non-normality of the population!
  3. Sheskin (2007) suggests using a t-test anyway but using a more conservative approach (e.g critical values of t(0.01) instead of t(0.05).

How can I resolve this problem?

added 224 characters in body
Source Link
Cesare Camestre
  • 719
  • 4
  • 17
  • 28
Loading
deleted 4 characters in body
Source Link
Gala
  • 8.6k
  • 2
  • 32
  • 44
Loading
deleted 2 characters in body; edited title
Source Link
Nick Cox
  • 59.5k
  • 8
  • 136
  • 212
Loading
added 144 characters in body
Source Link
Cesare Camestre
  • 719
  • 4
  • 17
  • 28
Loading
Source Link
Cesare Camestre
  • 719
  • 4
  • 17
  • 28
Loading