added 644 characters in body
Source Link
mbp
  • 41
  • 5

edit below

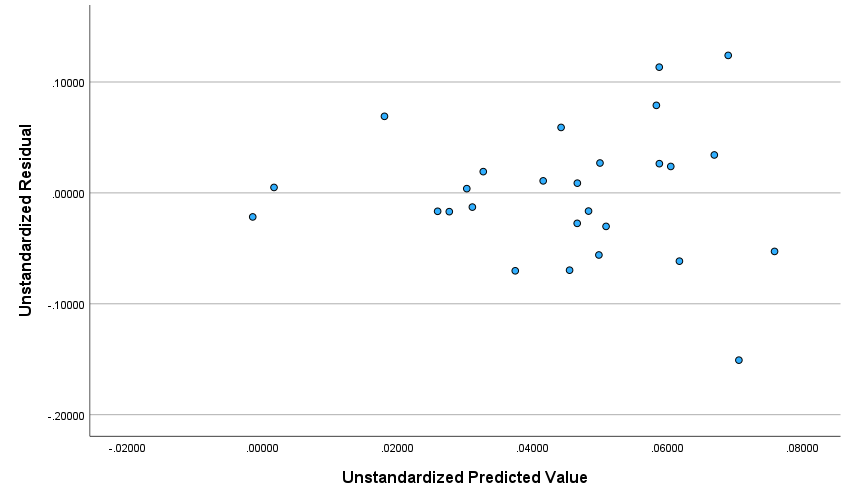
I am doing this analysis for the first time. How concerned should I be about heteroscedasticity in my data? Here's the scatterplot of predicted values vs residuals: scatterplot of predicted values vs residuals The Breusch-Pagan test is significant at p=.03 (χ²=4.682), so below <.05, but not .01.
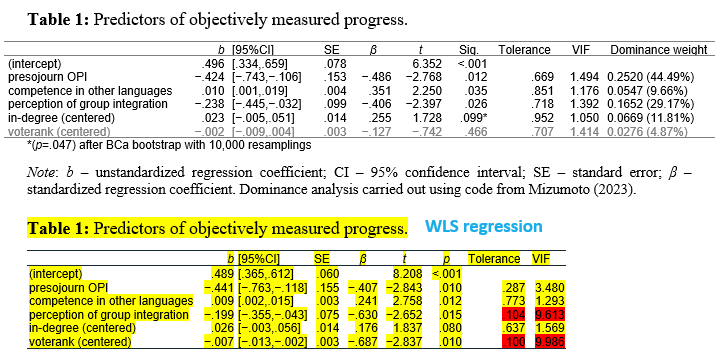
With regular multiple regression, the result is the first table below, quite nice. If instead I try WLS regression, the values change drastically (table highlighted in yellow), with two predictors ending up with unacceptable collinearity indices: enter image description here
Here is the original dataset if it helps: https://docs.google.com/spreadsheets/d/13U7xDK7otj-vBOcx6yTpsguAd-wlFNad/edit?usp=sharing&ouid=113244913961284427801&rtpof=true&sd=true

Thanks a lot in advance!

EDIT Thanks, Everyone, for the comments!

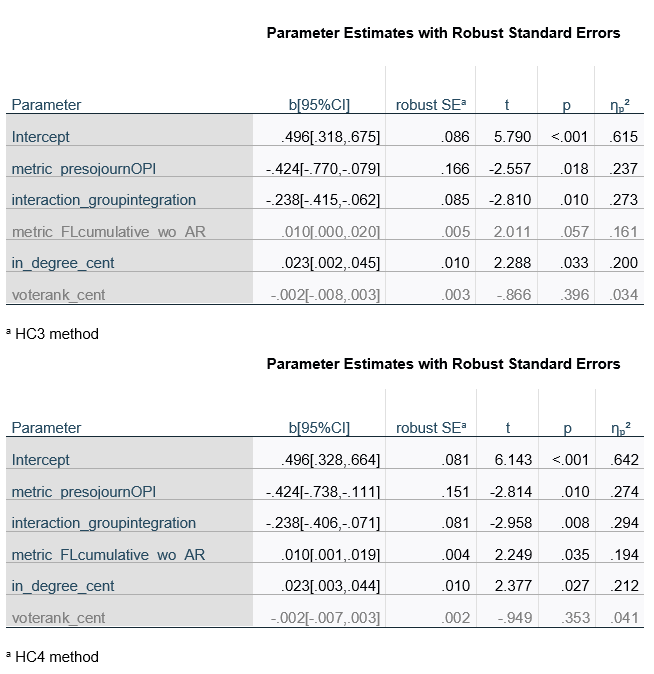
So, I ran regression with heteroscedasticity-consistent (robust) SEs:

regression with robust SEs

Is my understanding correct that the standardized beta values remain unchanged; what changes is the SEs, confidence intervals, p and t values, and effect sizes?

And, does anyone know how to get output for robust SEs complemented by i) confidence intervals for beta, ii) Tolerance and iii) VIF values (unless the latter two do not change with robust SEs; they do in weighted regression), either in SPSS or R?

I am doing this analysis for the first time. How concerned should I be about heteroscedasticity in my data? Here's the scatterplot of predicted values vs residuals: scatterplot of predicted values vs residuals The Breusch-Pagan test is significant at p=.03 (χ²=4.682), so below <.05, but not .01.

With regular multiple regression, the result is the first table below, quite nice. If instead I try WLS regression, the values change drastically (table highlighted in yellow), with two predictors ending up with unacceptable collinearity indices: enter image description here

Here is the original dataset if it helps: https://docs.google.com/spreadsheets/d/13U7xDK7otj-vBOcx6yTpsguAd-wlFNad/edit?usp=sharing&ouid=113244913961284427801&rtpof=true&sd=true

Thanks a lot in advance!

edit below

I am doing this analysis for the first time. How concerned should I be about heteroscedasticity in my data? Here's the scatterplot of predicted values vs residuals: scatterplot of predicted values vs residuals The Breusch-Pagan test is significant at p=.03 (χ²=4.682), so below <.05, but not .01.

With regular multiple regression, the result is the first table below, quite nice. If instead I try WLS regression, the values change drastically (table highlighted in yellow), with two predictors ending up with unacceptable collinearity indices: enter image description here

Here is the original dataset if it helps: https://docs.google.com/spreadsheets/d/13U7xDK7otj-vBOcx6yTpsguAd-wlFNad/edit?usp=sharing&ouid=113244913961284427801&rtpof=true&sd=true

Thanks a lot in advance!

EDIT Thanks, Everyone, for the comments!

So, I ran regression with heteroscedasticity-consistent (robust) SEs:

regression with robust SEs

Is my understanding correct that the standardized beta values remain unchanged; what changes is the SEs, confidence intervals, p and t values, and effect sizes?

And, does anyone know how to get output for robust SEs complemented by i) confidence intervals for beta, ii) Tolerance and iii) VIF values (unless the latter two do not change with robust SEs; they do in weighted regression), either in SPSS or R?

Source Link
mbp
  • 41
  • 5

How critical/serious is the heteroscedasticity in my data (Breusch-Pagan test significant at p=.03)?

I am doing this analysis for the first time. How concerned should I be about heteroscedasticity in my data? Here's the scatterplot of predicted values vs residuals: scatterplot of predicted values vs residuals The Breusch-Pagan test is significant at p=.03 (χ²=4.682), so below <.05, but not .01.

With regular multiple regression, the result is the first table below, quite nice. If instead I try WLS regression, the values change drastically (table highlighted in yellow), with two predictors ending up with unacceptable collinearity indices: enter image description here

Here is the original dataset if it helps: https://docs.google.com/spreadsheets/d/13U7xDK7otj-vBOcx6yTpsguAd-wlFNad/edit?usp=sharing&ouid=113244913961284427801&rtpof=true&sd=true

Thanks a lot in advance!