provided additional context
Source Link
Bren
  • 97
  • 5

Additional Information (as requested by EdM):

  • This analysis originates from a retrospective cohort study with follow-up interviews collected at 1, 2, 5, and 10 years from the date of injury. The "start time" in the present analysis is the Year 1 interview date. (This was chosen as the start time because the main covariate of interest, depression_level, was not collected until the first follow-up interview.)

  • The datasets for the 5- and 10-year models contained 1,228 and 1,245 total participants, respectively. There were 113 events in the 5-year model (9.2% mortality rate) and 219 events in the 10-year model (17.6% mortality rate).

  • We sought to evaluate the 5- and 10-year follow-up periods separately as these are specific time points of interest within the literature on our cohort study (which collects follow-up data at 1, 2, 5, and 10 years after study enrollment) as well as in the field more generally.

  • The x-axis is measured as time (in years). It's the number of years from the first (Year 1) follow-up interview until either censorship or death.

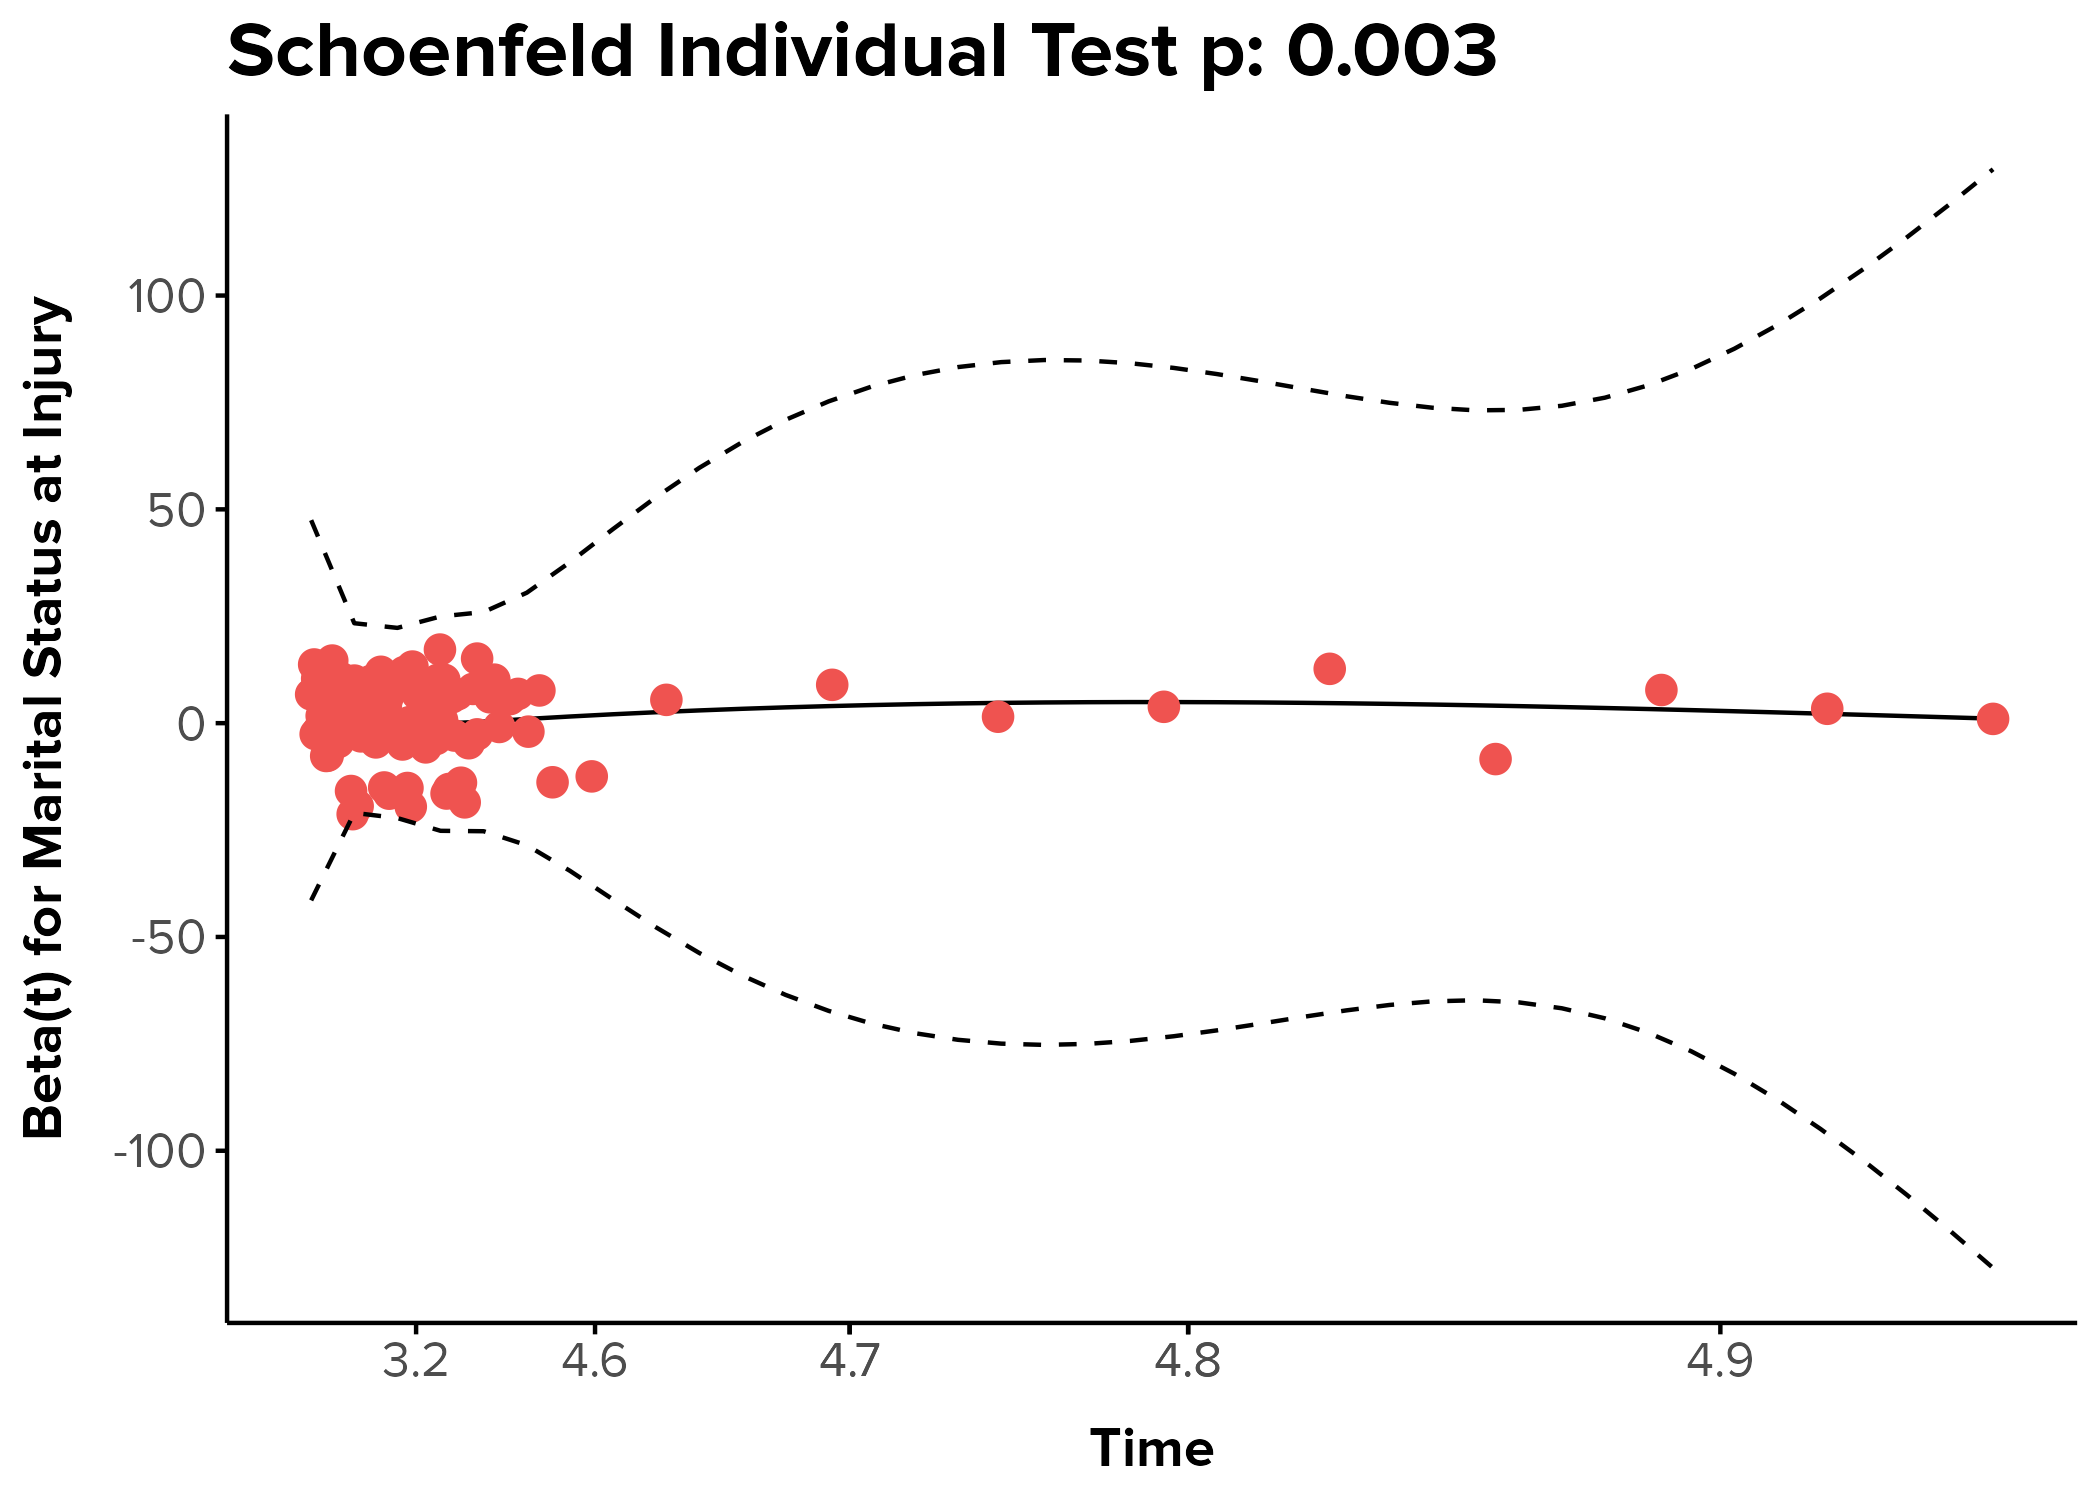
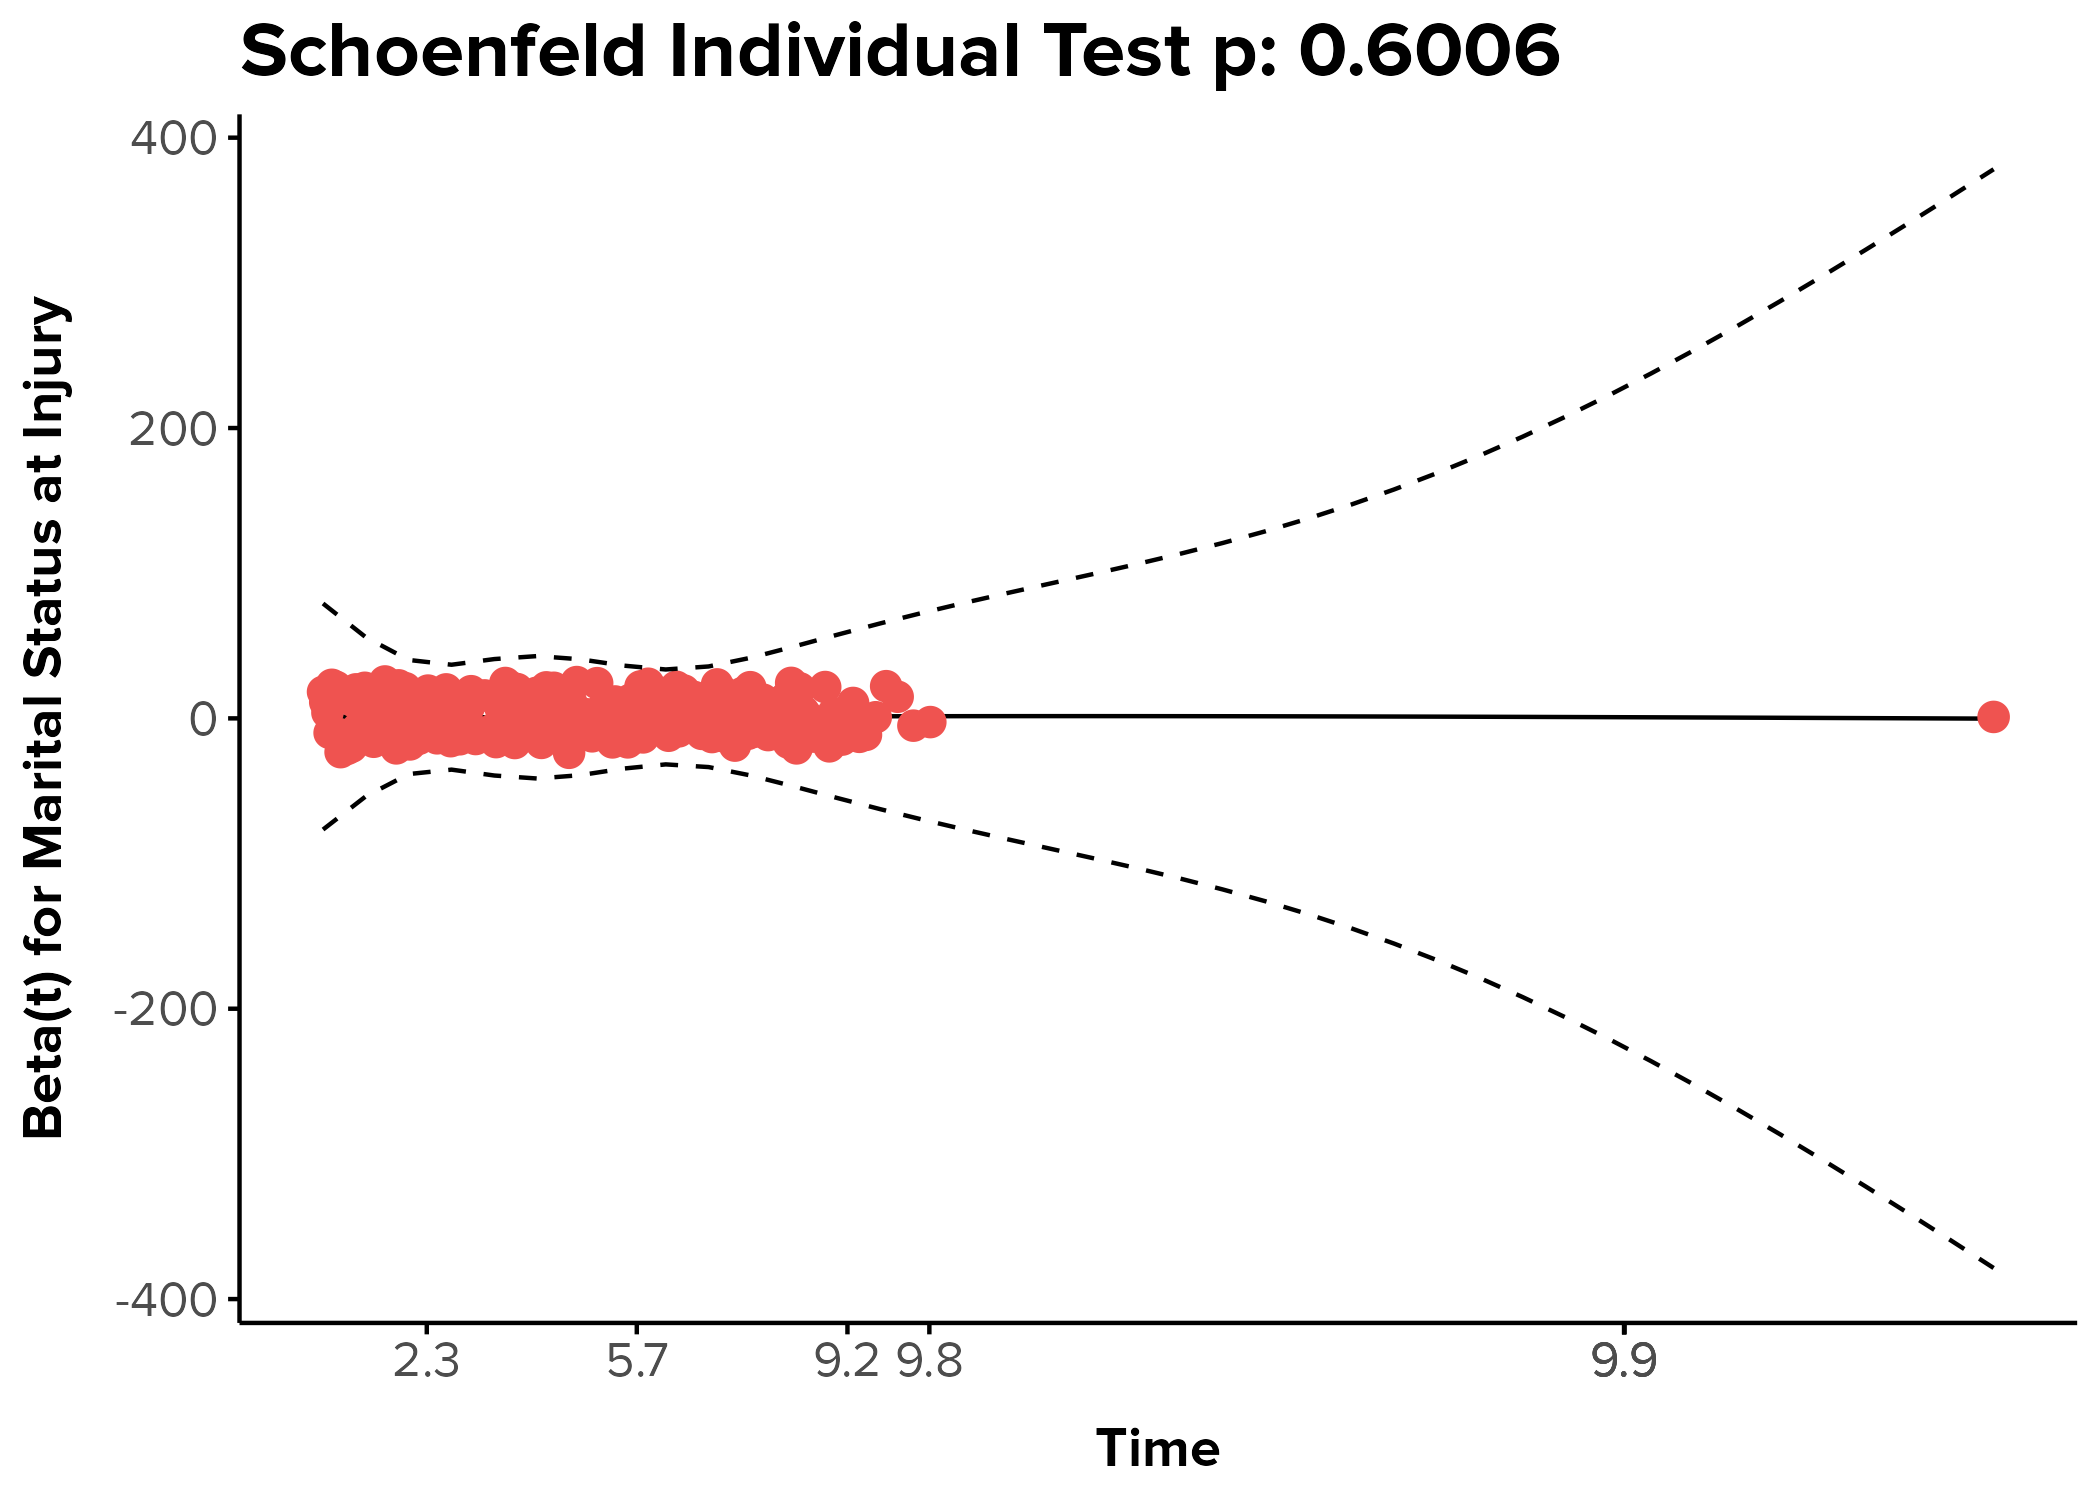
As requested, here are the Schoenfeld residual plots for a predictor, marital_status, that failed PH in the 5-year model but not the 10-year model:

5-year Schoenfeld residual:

schoenfeld residual of marital status in the 5-year model

10-year Schoenfeld residual:

enter image description here

added 4 characters in body
Source Link
Bren
  • 97
  • 5
Variable Chisq df p-value
Depression Level 0.757 2 0.68490685
Variable 2 5.524 2 0.063160632
Variable 3 4.514 2 0.10467105
Variable 4 11.104 2 0.003880.004
Calendar Year 1.492 1 0.22191222
Age 7.278 1 0.006980.007
Sex 0.625 1 0.42923429
Education Level 5.889 1 0.01523015
Employment Status 22.739 4 0.00014<0.001
Marital Status 13.914 3 0.003020.003
Medicaid Status 0.777 1 0.37801378
Mechanism 26.795 3 0.0000065<0.001
Variable 13 21.838 1 0.0000030<0.001
Variable 14 21.566 1 0.0000034<0.001
Variable 15 12.990 1 0.00031<0.001
GLOBAL 31.6802 26 0.000720.001
Variable Chisq df p-value
Depression Level 0.757 2 0.68490
Variable 2 5.524 2 0.06316
Variable 3 4.514 2 0.10467
Variable 4 11.104 2 0.00388
Calendar Year 1.492 1 0.22191
Age 7.278 1 0.00698
Sex 0.625 1 0.42923
Education Level 5.889 1 0.01523
Employment Status 22.739 4 0.00014
Marital Status 13.914 3 0.00302
Medicaid Status 0.777 1 0.37801
Mechanism 26.795 3 0.0000065
Variable 13 21.838 1 0.0000030
Variable 14 21.566 1 0.0000034
Variable 15 12.990 1 0.00031
GLOBAL 31.6802 26 0.00072
Variable Chisq df p-value
Depression Level 0.757 2 0.685
Variable 2 5.524 2 0.0632
Variable 3 4.514 2 0.105
Variable 4 11.104 2 0.004
Calendar Year 1.492 1 0.222
Age 7.278 1 0.007
Sex 0.625 1 0.429
Education Level 5.889 1 0.015
Employment Status 22.739 4 <0.001
Marital Status 13.914 3 0.003
Medicaid Status 0.777 1 0.378
Mechanism 26.795 3 <0.001
Variable 13 21.838 1 <0.001
Variable 14 21.566 1 <0.001
Variable 15 12.990 1 <0.001
GLOBAL 31.6802 26 0.001
Source Link
Bren
  • 97
  • 5

Changes in Schoenfeld Residuals Dependent on Follow-Up Time

It's my understanding that the proportional hazards assumption means that the effect of a covariate on the hazard rate (or the instantaneous risk of an event) remains constant over time. In practice, this means that the risk of an event for one group should be proportionally higher (or lower) than the other group throughout the entire study period...

I am currently testing two Cox proportional hazards regression models, both of which are identical apart from their follow-up times (5 years and 10 years, respectively). The results of the Schoenfeld test for each model are shown below:

5-Year Model Schoenfeld Test Results:

Variable Chisq df p-value
Depression Level 0.757 2 0.68490
Variable 2 5.524 2 0.06316
Variable 3 4.514 2 0.10467
Variable 4 11.104 2 0.00388
Calendar Year 1.492 1 0.22191
Age 7.278 1 0.00698
Sex 0.625 1 0.42923
Education Level 5.889 1 0.01523
Employment Status 22.739 4 0.00014
Marital Status 13.914 3 0.00302
Medicaid Status 0.777 1 0.37801
Mechanism 26.795 3 0.0000065
Variable 13 21.838 1 0.0000030
Variable 14 21.566 1 0.0000034
Variable 15 12.990 1 0.00031
GLOBAL 31.6802 26 0.00072

10-Year Model Schoenfeld Test Results:

Variable Chisq df p-value
Depression Level 6.4271 2 0.040
Variable 2 1.2341 2 0.540
Variable 3 2.0940 2 0.351
Variable 4 0.0656 2 0.968
Calendar Year 1.5297 1 0.216
Age 3.7158 1 0.054
Sex 0.3735 1 0.541
Education Level 0.0380 1 0.845
Employment Status 6.7776 4 0.148
Marital Status 1.8665 3 0.601
Medicaid Status 0.1716 1 0.679
Mechanism 5.0215 3 0.170
Variable 13 0.7751 1 0.379
Variable 14 0.0739 1 0.786
Variable 15 0.2949 1 0.587
GLOBAL 31.6802 26 0.204

Are these results contradictory? That is, is it guaranteed that a covariate that violates the PH assumption in a model with a shorter follow-up time should necessarily violate the PH assumption in a model with a longer follow-up time? In the example above: Is it possible for multiple (9/15) covariates to violate the PH assumption in a Cox regression model that follows participants for 5 years but not for the same model with a 10-year follow-up period?

What could this mean about the set of violating covariates in the 5-year model? Does it mean that the effects of the violating predictors on the hazard of death change more rapidly over the initial 5 years compared to later years? Does it mean, for example, that age and education level have strong initial effects that diminish over time?