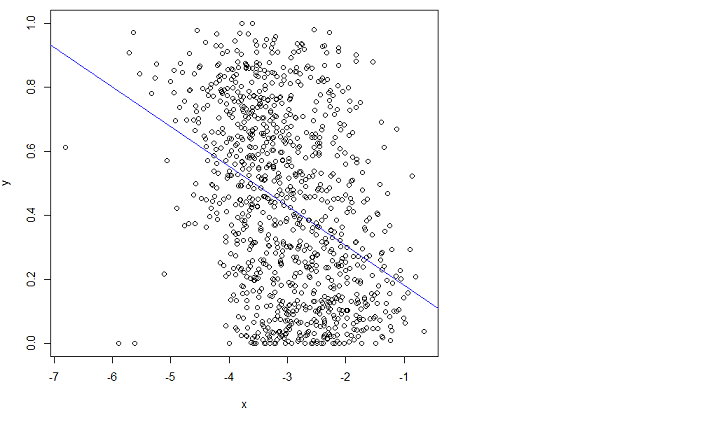
Sorry for this beginner's question... I have googled this for a while with no success.
I do a linear regression using R lm function:
x = log(errors)
plot(x,y)
lm.result = lm(formula = y ~ x)
abline(lm.result, col="blue") # showing the "fit" in blue

but it does not fit well. Unfortunately I can't make sense of the manual.
Can someone point me in the right direction to fit this better?
By fitting I mean I want to minimize the Root Mean Squared Error (RMSE).
Edit: I have posted a related question (it's the same problem) here: Can I decrease further the RMSE based on this feature?
and the raw data here:
except that on that link x is what is called errors on the present page here, and there are less samples (1000 vs 3000 in the present page plot). I wanted to make things simpler in the other question.
