3
$\begingroup$

I would like to compare birth weight of babies in the general population with the birth weights measured in my research sample (birth weight from babies delivered by mothers on a specific drug treatment). The birth weight in the general population follows a normal distribution. My own research sample is small (24 babies) and does not follow a normal distribution.

Is it possible to use the Z-score to find statistical differences in birth weight between the two groups? And if not, what analyses should I perform?

Data and equation

Mean birth weight population = 3390 gram

Mean birth weight sample = 3668 gram Standard deviation sample = 516 gram

Z-score = (3668 - 3390 ) / 516 = 0.455

Birth weight sample - male

3850

4995

3925

3430

3825

3905

Birth weight sample - female

3955

3635

3530

2940

3820

3300

2915

3340

Standard deviation sample female = 379

Standard deviation sample male = 525

Mean population birth weight female = 3293

Mean population birth weight male = 3487

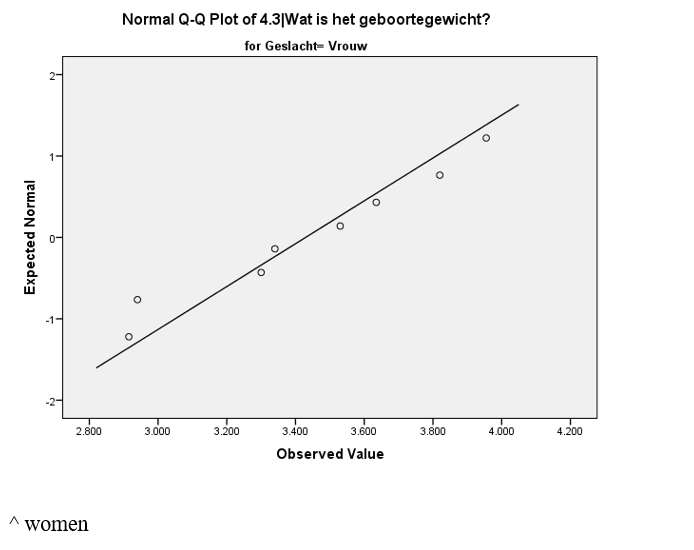
qqplot for girls:

enter image description here

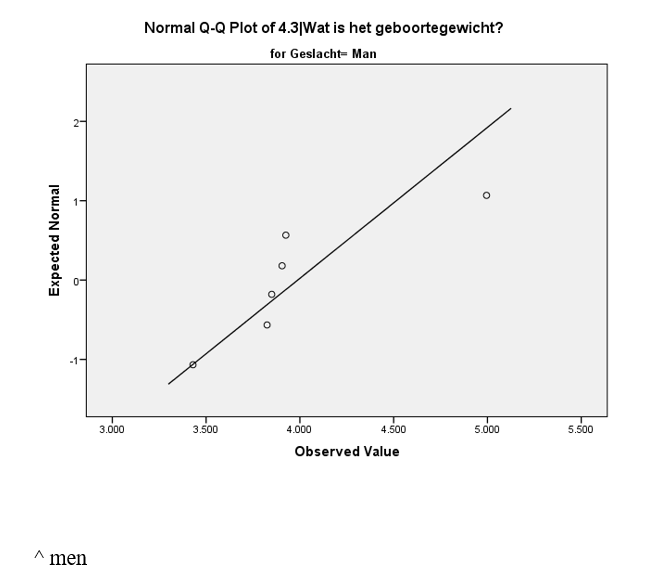
qqplot for boys:

enter image description here

$\endgroup$
10
  • $\begingroup$ In my experience, weight data pretty nicely fit to the normal distribution. Can you post a quantile-quantile plot o your sample? I think you should be using a t-test and not a z-test, since the population variance is, I guess, unknown. $\endgroup$
    – utobi
    Commented Jul 12, 2023 at 10:46
  • $\begingroup$ If you only have 24 data points, you could edit your post to include the raw data. We might be able to help you better with that. $\endgroup$ Commented Jul 12, 2023 at 10:59
  • $\begingroup$ Thanks for your reply! The genders combined and women separately have a normal distribution, for men it does not. See imgur.com/1n0VmxD for the Q-Q plot $\endgroup$
    – Kimberley
    Commented Jul 12, 2023 at 10:59
  • 2
    $\begingroup$ Ah, so you also have a gender variable, that makes it a bit more problematic.... That plot only shows six data points, are these just the boys or just the girls? $\endgroup$ Commented Jul 12, 2023 at 11:01
  • 1
    $\begingroup$ $Z$ scores are only for normally distributed data, and they use standard deviations which are largely for symmetric distributions (of which normal distributions are examples). They needlessly complicate the problem and I seldom recommend $Z$ scores for any purpose. $\endgroup$ Commented Jul 12, 2023 at 11:30

1 Answer 1

6
$\begingroup$

A simple approach would be to bootstrap means.

  • For the boys, this yields $p<0.0001$, that is, out of my 10,000 bootstrapped means, not a single one was below the boys' population mean weight.

  • For the girls, I get $p=0.15$ for the comparison of the bootstrapped mean against the population mean (i.e., 15% of my bootstrapped means are below the population mean).

  • In principle, you should really adjust these p-values for the multiple (two) tests you ran... but that won't make a difference, since $p=0$ will remain zero for the boys, and the nonsignificant result for the girls will remain nonsignificant.

Below is a plot of all your data, with group means and bootstrapped 95% confidence intervals for the means, and the population mean in red. If you had more data, you should really jitter the points horizontally.
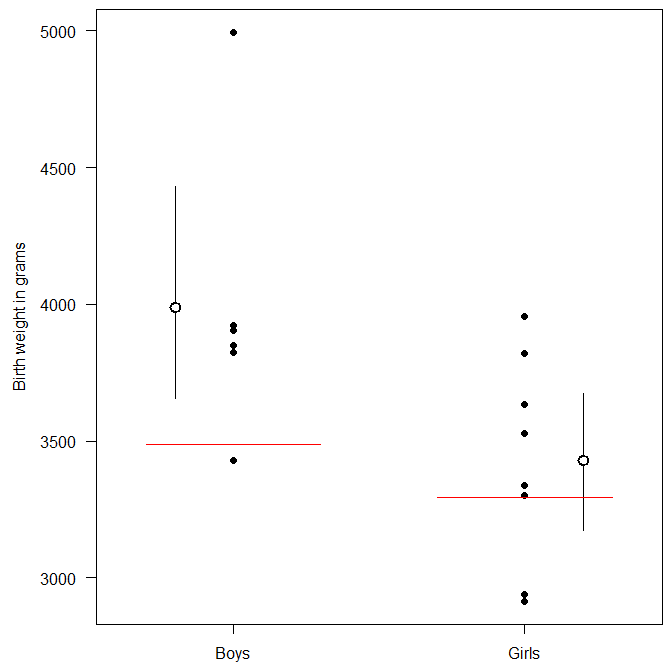
birth weights

Needless to say (I hope), you should be really careful about drawing conclusions from data samples this small.

R code:

boys <- c(3850, 4995, 3925, 3430, 3825, 3905)
girls <- c(3955, 3635, 3530, 2940, 3820, 3300, 2915, 3340)
population_boys <- 3487
population_girls <- 3293

library(boot)

# Boys:
set.seed(1) # for reproducibility
boot_boys <- boot(boys,function(x,i)mean(x[i]),R=10000)
boot_boys$t0	# mean
sd(boot_boys$t)   # standard error of the bootstrapped mean
ecdf(boot_boys$t)(population_boys)  # p value for one-sided test for equality with the population average

# Girls:
set.seed(1) # for reproducibility
boot_girls <- boot(girls,function(x,i)mean(x[i]),R=10000)
boot_girls$t0	# mean
sd(boot_girls$t)  # standard error of the bootstrapped mean
ecdf(boot_girls$t)(population_girls)    # p value for one-sided test for equality with the population average

opar <- par(mai=c(.5,1,.1,.1))
    plot(c(.6,2.4),range(c(boys,girls,population_boys,population_girls)),
        type="n",xlab="",ylab="",las=1,xaxt="n")
    mtext("Birth weight in grams",2,line=3.5)
    axis(1,c(1,2),c("Boys","Girls"))
    # plot boys
    points(rep(1,length(boys)),boys,pch=19)
    lines(c(0.8,0.8),quantile(boot_boys$t,c(0.025,0.975)))
	points(0.8,boot_boys$t0,pch=21,bg="white",cex=1.5,lwd=2)
    # plot girls
    points(rep(2,length(girls)),girls,pch=19)
    lines(c(2.2,2.2),quantile(boot_girls$t,c(0.025,0.975)))
	points(2.2,boot_girls$t0,pch=21,bg="white",cex=1.5,lwd=2)
    # plot population
    lines(c(.7,1.3),rep(population_boys,2),col="red")
    lines(c(1.7,2.3),rep(population_girls,2),col="red")
par(opar)
$\endgroup$
3
  • $\begingroup$ +1. I think, probably, though, OP will want to compare Females and Males to the population mean for each, 3300 and 3500 g. (Which could be displayed as two horizontal lines on the plot, as long as they aren't displayed with a pink line and a blue line ! ) $\endgroup$ Commented Jul 12, 2023 at 12:29
  • $\begingroup$ @SalMangiafico: thanks, I had completely overlooked that piece of information... let me edit... $\endgroup$ Commented Jul 12, 2023 at 12:32
  • $\begingroup$ Thank you so much for your extensive answer @StephanKolassa! Never even thought about bootstrapping, I can definitely use this information. And we will be very careful with interpretation, its for preliminary research (if significance is even going to be used after all). $\endgroup$
    – Kimberley
    Commented Jul 12, 2023 at 13:18

Your Answer

By clicking “Post Your Answer”, you agree to our terms of service and acknowledge you have read our privacy policy.

Not the answer you're looking for? Browse other questions tagged or ask your own question.