I am having an issue fitting a gam with mgcv in R and am looking for some help. In brief, I have a dataset that contains numbers of fish from one of two groups (Hatchery or Wild) that were detected at receivers located in a large lake system. These receivers are placed at specific locations and have a unique longitude and latitude. The dataset was collected across 4 years. I am looking to model the number of fish detected at the receivers in each group across the study period. I have done this in R with mgcv using the following code:
mod1 <- gam(number_of_fish ~ s(x, y, by = origin, k = 40) + s(study_year, k = 3) + origin, offset = log(max_fish),
          data = n_fish_spring_utm,
          family=nb(link = 'log'),
          method = "REML")
Here, I am using an offset for the log maximum number of fish in each group that could have been detected as the two groups had different numbers of fish. I am also using a negative binomial distribution.
This model seems to run fine.
Parametric coefficients:
            Estimate Std. Error  z value Pr(>|z|)
(Intercept) -2.83417    0.02592 -109.327  < 2e-16 ***
originWild   0.31964    0.04188    7.632  2.3e-14 ***
---
Signif. codes:  0 ‘***’ 0.001 ‘**’ 0.01 ‘*’ 0.05 ‘.’ 0.1 ‘ ’ 1

Approximate significance of smooth terms:
                         edf Ref.df Chi.sq p-value
s(x,y):originHatchery 16.393 21.146  252.9  <2e-16 ***
s(x,y):originWild     12.041 16.024  144.5  <2e-16 ***
s(study_year)          1.871  1.983  274.2  <2e-16 ***
---
Signif. codes:  0 ‘***’ 0.001 ‘**’ 0.01 ‘*’ 0.05 ‘.’ 0.1 ‘ ’ 1

R-sq.(adj) =  0.306   Deviance explained = 50.2%
-REML = 2258.5  Scale est. = 1         n = 1347
However, my lake system has lots of contours and a few large islands which I want to account for using a soap film smoother.
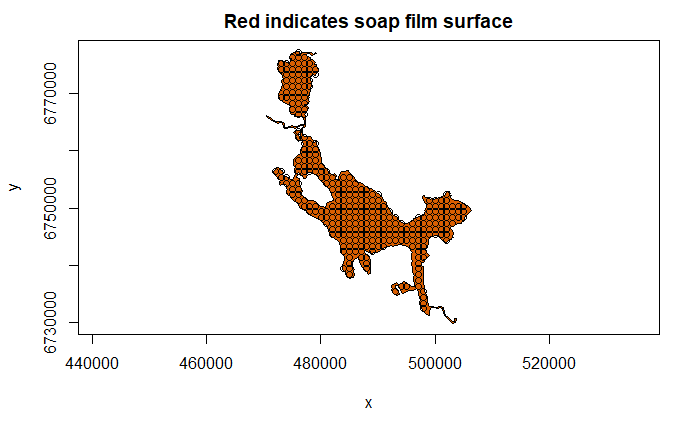
I generated a soap film surface using a shapefile of my lake system, and checked that it was all fine (i.e. no knots fell outside the boundry) with the soapcheckr() package.

I then ran the following model, including the soap film smoother:
mod2 <- gam(number_of_fish ~ s(x, y, by = origin, k = 40, bs = "so", xt = list(bnd = border.aut, nmax=1500)) + s(study_year, k = 3) + origin, offset=log(max_fish),
          data = n_fish_spring_utm,
          family=nb(link = 'log'),
          method = "REML",
          knots = lake_knots)
The model runs fine.
Parametric coefficients:
            Estimate Std. Error z value Pr(>|z|)
(Intercept)  -2.8287     4.4271  -0.639    0.523
originWild    0.2641    13.2274   0.020    0.984

Approximate significance of smooth terms:
                         edf Ref.df Chi.sq p-value
s(x,y):originHatchery 42.000  42.00  216.9  <2e-16 ***
s(x,y):originWild     42.000  42.00  173.2  <2e-16 ***
s(study_year)          1.827   1.97  230.4  <2e-16 ***
---
Signif. codes:  0 ‘***’ 0.001 ‘**’ 0.01 ‘*’ 0.05 ‘.’ 0.1 ‘ ’ 1

Rank: 308/866
R-sq.(adj) =  0.307   Deviance explained = 52.7%
-REML =   1640  Scale est. = 1         n = 1347
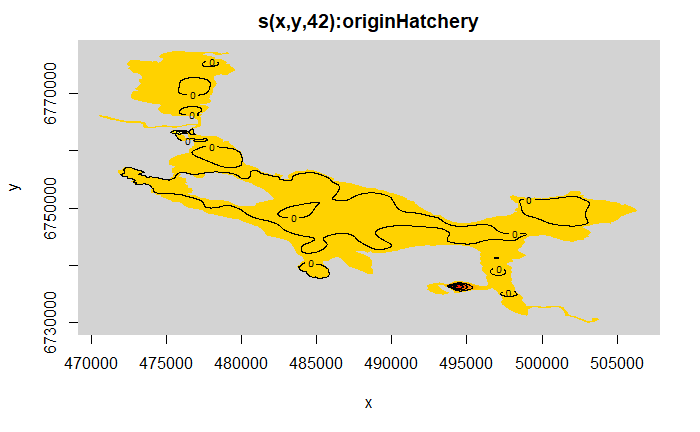
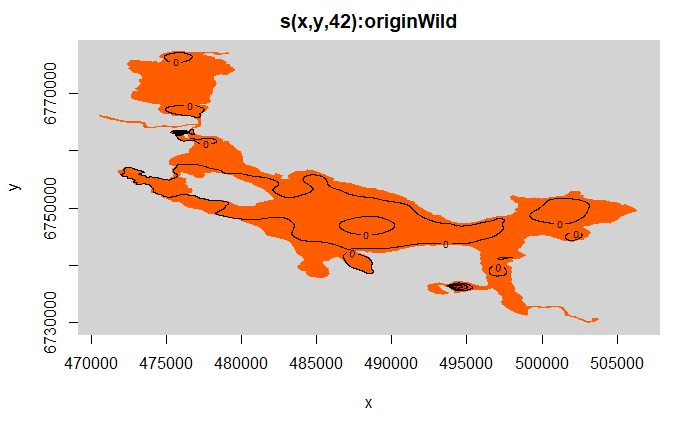
However, the plots do not seem sensible and indicate zero fish detected.


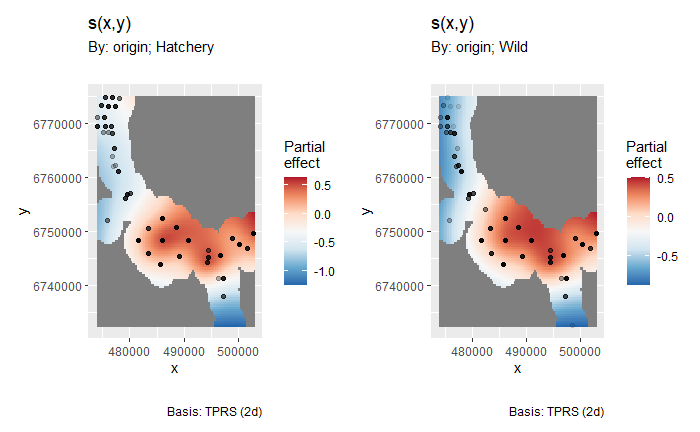
I also cannot generate plots from my model with the gratia() package as I did previously. I get the following error message:
Error in `mutate()`:ℹ In argument: `.loop = rep(seq_along(pts), each = pts)`.Caused by error:! `.loop` must be size 536 or 1, not 1446.
I have been tinkering with this for around a week and cannot seem to solve the issue. Any help or even a nudge in the right direction would be greatly appreciated!
Code, data, and the shapefile can be found here.
Thanks in advance!

