I need to perform a two-way ANOVA on my data. My data is from a non-normal population. Apparently there is no two or three factor test for non-normal populations. I realized I need to transform my data, but I'm unsure about which transformation to perform on my data, I don't know which is the most appropriate. I don't know what is the criteria to choose one from the transformation list of possibilities?
-
1$\begingroup$ ANOVA does not assume the data are normal it assumes the residuals are normal. $\endgroup$– Peter FlomCommented Nov 8, 2013 at 19:39
-
1$\begingroup$ Following on what Peter said, if any of the factors are repeated measures it assumes the residuals of aggregate data are normal. And, those aggregates can become normal even if terribly not normal, through the central limit theorem. But all that aside, many a transformation list is garbage and no one here knows what one you're reading. Perhaps a figure showing your residuals and data would yield substantially better results. Otherwise, just Google data transformation. $\endgroup$– JohnCommented Nov 8, 2013 at 20:23
-
1$\begingroup$ The method described at stats.stackexchange.com/questions/74537/… works even better for ANOVA: its natural groupings of data are perfect for constructing a spread-vs-level plot. $\endgroup$– whuber ♦Commented Nov 8, 2013 at 21:00
2 Answers
Transformation that will change the shape leaves you no longer comparing means. If you really want to compare means you may want to avoid transform (there can be some particular exceptions where, at least with some accompanying assumptions, you can compute or approximate the means on the original scale as well).
If you don't need an estimate of the difference in means on the original scale (i.e. if effect sizes aren't critical to your analysis), then full-factorial models (i.e. with all interactions present) may work well enough with transformation.
If you are happy with more general location-comparisons than just means, there are other alternatives than transformation.
If you do want to compare means there are other alternatives than transformation. I'm not saying 'never use transformation'... but 'consider alternatives'.
Apparently there is no two or three factor test for non-normal populations.
This is untrue. This could be done with GLMs for example. Or via resampling.
Non-normality may not be the biggest issue you have (heteroskedasticity tends to have a bigger impact, one that doesn't diminish so nicely with sample size)
A nonlinear transformation will change many things. In your case, the important ones are distributional shape, variance of the transformed variables, and what means on the transformed scale correspond to on the original scale and vice versa. (In a regression situation there's also the impact on linearity of relationships)
You might choose a transformation that takes you to nearly constant variance. You might choose one that takes you to near symmetry. You might choose one that does either of those things less well, but is more interpretable.
If you're very lucky, you might be in a situation that gets you more than one of those at once.
But again, my advice is to first consider alternatives. As a first step, you might want to investigate what could be done with GLMs.
What are the characteristics of your data? What makes you say they're non-normal? Do you have counts? Are the data highly skew*?
* note that its not the unconditional distribution of the response that's crucial, but the conditional distribution.
-
1$\begingroup$ Because ANOVA is typically employed to identify shifts in location, what kind of average is used in the comparisons often is immaterial. Thus things might not be as problematic as you suggest. Moreover, it is often the case that a nonlinear transformation to achieve homoscedasticity also achieves approximate symmetry and--in regression situations--frequently makes relationships more linear, too. Although that's not a mathematical fact, it's not a matter of being "very lucky," either. Moreover, a single transformation is more parsimonious and easier to interpret than a set of interactions. $\endgroup$– whuber ♦Commented Nov 8, 2013 at 22:36
-
$\begingroup$ @whuber I won't dispute your general gist there, but for example among the exponential family (I mean the family used in GLMs, rather than in the broadest possible sense) with power-variance functions, the (asymptotic) variance stabilizing transformations are stronger than the (asymptotic) symmetrizing ones; with cases like those you can't even get lucky (except very roughly). You can get to symmetry or equal variance, but not both at once. $\endgroup$– Glen_bCommented Nov 8, 2013 at 22:47
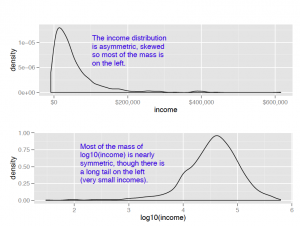
Look at the distribution of your data via a histogram, and then see what type of distribution it resembles. For example, if your data is heavily skewed towards the low end of the scale, the data might benefit from a log(10) transformation:

A log transform of this particular data would make it at least close to normal. This particular example can be found here.
Examine the distribution of your outcome data, and then choose the appropriate transformation.
-
4$\begingroup$ Sometimes this method works, but it has a significant shortcoming: because what matters is the distribution of the residuals, in many cases the distribution of the raw data reflects the distribution of the independent variables more than anything else and basing a transformation on their histogram is incorrect. $\endgroup$– whuber ♦Commented Nov 8, 2013 at 20:58
