16
$\begingroup$

I have two parts of a multidimensional data set, let's call them train and test. And I want to built a model based on the train data set and then validate it on the test data set. The number of clusters is known.

I tried to apply k-means clustering in R and I got an object that contains the centers of clusters:

kClust <- kmeans(train, centers=N, nstart=M)

Is there a function in R that takes the centers of clusters that were found and assigns clusters to my test data set?

What are the other methods/algorithms that I can try?

$\endgroup$
6
  • $\begingroup$ Welcome to the site, @user2598356. Can you frame this in a more general (non-R specific) way? If you are only asking for an R function, this question would be off-topic for CV (see our help page). Moreover, it would be off-topic on Stack Overflow as well, since it doesn't have a reproducible example. If you can edit this to make it on-topic here or on SO, please do so. Otherwise, this Q may be closed. $\endgroup$ Commented Dec 3, 2013 at 13:59
  • $\begingroup$ This question appears to be off-topic because it is about finding an R function. $\endgroup$ Commented Dec 3, 2013 at 13:59
  • 1
    $\begingroup$ But what's about the last question: "What are the other methods/algorithms that I can try?". Actually the answer that I got concerns implementation of the methods which is a topic of CV, or am I wrong? $\endgroup$ Commented Dec 3, 2013 at 14:05
  • 1
    $\begingroup$ @gung You might be right, in which case I invite user259... to flag this question for migration. However, the last part of the question about other methods and algorithms suggests our community may be in a good position to offer useful help and advice. $\endgroup$
    – whuber
    Commented Dec 3, 2013 at 14:06
  • $\begingroup$ Thanks! The function works well, but it takes too much time if you have more than 50k rows. Any idea to make it lighter? $\endgroup$
    – user44314
    Commented Apr 23, 2014 at 10:58

2 Answers 2

14
$\begingroup$

You can compute the cluster assignments for a new data set with the following function:

clusters <- function(x, centers) {
  # compute squared euclidean distance from each sample to each cluster center
  tmp <- sapply(seq_len(nrow(x)),
                function(i) apply(centers, 1,
                                  function(v) sum((x[i, ]-v)^2)))
  max.col(-t(tmp))  # find index of min distance
}

# create a simple data set with two clusters
set.seed(1)
x <- rbind(matrix(rnorm(100, sd = 0.3), ncol = 2),
           matrix(rnorm(100, mean = 1, sd = 0.3), ncol = 2))
colnames(x) <- c("x", "y")
x_new <- rbind(matrix(rnorm(10, sd = 0.3), ncol = 2),
               matrix(rnorm(10, mean = 1, sd = 0.3), ncol = 2))
colnames(x_new) <- c("x", "y")

cl <- kmeans(x, centers=2)

all.equal(cl[["cluster"]], clusters(x, cl[["centers"]]))
# [1] TRUE
clusters(x_new, cl[["centers"]])
# [1] 2 2 2 2 2 1 1 1 1 1

plot(x, col=cl$cluster, pch=3)
points(x_new, col= clusters(x_new, cl[["centers"]]), pch=19)
points(cl[["centers"]], pch=4, cex=2, col="blue")
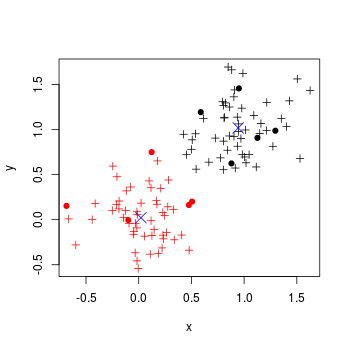
cluster assignment

or you could use the flexclust package, which has an implemented predict method for k-means:

library("flexclust")
data("Nclus")

set.seed(1)
dat <- as.data.frame(Nclus)
ind <- sample(nrow(dat), 50)

dat[["train"]] <- TRUE
dat[["train"]][ind] <- FALSE

cl1 = kcca(dat[dat[["train"]]==TRUE, 1:2], k=4, kccaFamily("kmeans"))
cl1    
#
# call:
# kcca(x = dat[dat[["train"]] == TRUE, 1:2], k = 4)
#
# cluster sizes:
#
#  1   2   3   4 
#130 181  98  91 

pred_train <- predict(cl1)
pred_test <- predict(cl1, newdata=dat[dat[["train"]]==FALSE, 1:2])

image(cl1)
points(dat[dat[["train"]]==TRUE, 1:2], col=pred_train, pch=19, cex=0.3)
points(dat[dat[["train"]]==FALSE, 1:2], col=pred_test, pch=22, bg="orange")
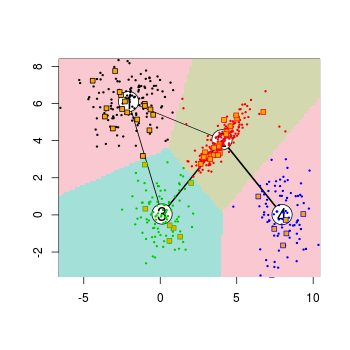
flexclust plot

There are also conversion methods to convert the results from cluster functions like stats::kmeans or cluster::pam to objects of class kcca and vice versa:

as.kcca(cl, data=x)
# kcca object of family ‘kmeans’ 
#
# call:
# as.kcca(object = cl, data = x)
#
# cluster sizes:
#
#  1  2 
#  50 50 
$\endgroup$
2
  • $\begingroup$ Thank you very much! Just one question: how does kcca methods deals with number of starts (is it optimises the analysis with regards to the starting points)? $\endgroup$ Commented Dec 3, 2013 at 13:59
  • $\begingroup$ What do you mean with number of starts? The stepFlexclust function runs clustering algorithms repeatedly for different numbers of clusters and returns the minimum within cluster distance solution for each. $\endgroup$
    – rcs
    Commented Dec 3, 2013 at 14:32
1
$\begingroup$

step1: a function computing distance between a vector and each row of a matrix

calc_vec2mat_dist = function(x, ref_mat) {
    # compute row-wise vec2vec distance 
    apply(ref_mat, 1, function(r) sum((r - x)^2))
}

step 2: a function that apply the vec2mat computer to every row of the input_matrix

calc_mat2mat_dist = function(input_mat, ref_mat) {

    dist_mat = apply(input_mat, 1, function(r) calc_vec2mat_dist(r, ref_mat))

    # transpose to have each row for each input datapoint
    # each column for each centroids
    cbind(t(dist_mat), max.col(-t(dist_mat)))
}

step3. apply the mat2mat function

calc_mat2mat_dist(my_input_mat, kmeans_model$centers)

step4. Optionally use plyr::ddply and doMC to parallelize mat2mat for big dataset

library(doMC)
library(plyr)

pred_cluster_para = function(input_df, center_mat, cl_feat, id_cols, use_ncore = 8) {
    # assign cluster lables for each individual (row) in the input_df 
    # input: input_df   - dataframe with all features used in clustering, plus some id/indicator columns
    # input: center_mat - matrix of centroid, K rows by M features
    # input: cl_feat    - list of features (col names)
    # input: id_cols    - list of index cols (e.g. id) to include in output 
    # output: output_df - dataframe with same number of rows as input, 
    #         K columns of distances to each clusters
    #         1 column of cluster_labels
    #         x column of indices in idx_cols

    n_cluster = nrow(center_mat)
    n_feat = ncol(center_mat)
    n_input = nrow(input_df)

    if(!(typeof(center_mat) %in% c('double','interger') & is.matrix(center_mat))){
        stop('The argument "center_mat" must be numeric matrix')
    } else if(length(cl_feat) != n_feat) {
        stop(sprintf('cl_feat size: %d , center_mat n_col: %d, they have to match!',length(cl_feat), n_feat))
    } else {
        # register MultiCore backend through doMC and foreach package
        doMC::registerDoMC(cores = use_ncore)

        # create job_key for mapping/spliting the input data
        input_df[,'job_idx'] = sample(1:use_ncore, n_input, replace = TRUE)

        # create row_key for tracing the original row order which will be shuffled by mapreduce
        input_df[,'row_idx'] = seq(n_input)

        # use ddply (df input, df output) to split-process-combine
        output_df = ddply(
            input_df[, c('job_idx','row_idx',cl_feat,id_cols)], # input big data 
            'job_idx',                       # map/split by job_idx
            function(chunk) {                # work on each chunk
                dist = data.frame(calc_mat2mat_dist(chunk[,cl_feat], center_mat))
                names(dist) = c(paste0('dist2c_', seq(n_cluster)), 'pred_cluster')
                dist[,id_cols] = chunk[,id_cols]
                dist[,'row_idx'] = chunk[,'row_idx']
                dist                        # product of mapper
                        }, .parallel = TRUE) # end of ddply
        # sort back to original row order

        output_df = output_df[order(output_df$row_idx),]
        output_df[c('job_idx')] = NULL
        return(output_df)
    }

}
$\endgroup$

Your Answer

By clicking “Post Your Answer”, you agree to our terms of service and acknowledge you have read our privacy policy.

Not the answer you're looking for? Browse other questions tagged or ask your own question.