7
$\begingroup$

I am conducting an empirical study of the relation between earnings and returns.

I have an unbalanced panel with $N=449$ firms and $T=36$ time periods. Regarding the estimation methods I am confused:

  1. In most of the papers they account for firm clustering and time issues and therefore cluster for firms and introduce time-dummy variable using OLS.

=> Is that the simple pooled OLS?

  1. If there are entity and time issues I thought that one should use the within (Fixed effects) or at least a weighted average of within and between (Random effects) estimator.

  2. I have run some diagnostic test: a) the Hausman test favors the fixed effects b) the Breusch-Pagan Lagrange Multiplier (LM) favors the OLS over the Random Effects

So the first question that appears is: How can I check pooled OLS vs Fixed Effects?

Additionally, my panel is unbalanced: firms in my panel might get bankrupt or merge with other companies. therefore, the question arises: In case of correlation of these pattern with the idiosyncratic errors, which is best to avoid biased estimtators?

The next issue regards Stata.I do not fully understand the difference of the following regressions:

1) reg y x i.time, cluster(id)

2) xtreg y x i.time, fe cluster(id) dfadj

3) xtreg y x i.time, re cluster(id)

Is the only difference the used estimator?

In most of the studies version 1) is used although I do not really get the advantage of version 1) over 2) or 3).

In which case is pooled OLS preferred over the other methods? I´ve noticed that the SE are largest when fixing for firm and time using the fe-estimator.

And the last question arises: If there are unobserved effects - firm and time: how can I determine if these effects are permanent or temporary (die away over time)?

Important for me is to get an inference robust result.

$\endgroup$
1
  • 1
    $\begingroup$ I think the second half of your question should be a separate question. $\endgroup$
    – AdamO
    Commented Aug 21, 2019 at 15:42

2 Answers 2

2
$\begingroup$
  1. "Clustering by firms" doesn't exclude OLS as a possibility. One could simply adjust for a dummy variable indicating the firm and objectively call that a "cluster". More commonly, "clustering by firm" means adding a random intercept term for firms. This is the preferred approach when the number of firms is large relatively to the sample size. Adding a random intercept makes this type of model a mixed effects model. Pooled OLS will estimate a random intercept and a random slope, thus is a more general model. However, the estimates can be very unstable when the number of observations-per-firm is small.

  2. Time can be handled using fixed effects as a dummy variable. It's better as a continuous variable. Splines interpolate dummy variables without requiring that all (or even more than 1) firm measure outcomes at exactly the same time. This can save you from binning or matching times and improves analysis significantly. You can still add a dummy variable for season if there are cyclic effects relating to time-of-year.

  3. Without a prespecified hypothesis about the impact of omitted variables, variance structures, or other things, the Hausman and Breush Pagan test make no sense in isolation. Diagnostic tests are prone to reject too often because they are simply over powered by moderate-to-large samples. It is better to use diagnostic plots like a variogram.

  4. One way to check pooled OLS vs fixed effects is to do a likelihood ratio test. They are both fully ML procedures. The numerator degrees of freedom for the pooled OLS would be $n_c * 2 + p$ where $p$ is the number of endogenous parameters (like firm type, season) and $n_c$ number of firms, 2 is the slope and intercept terms within each subOLS though they may be different.

$\endgroup$
-1
$\begingroup$

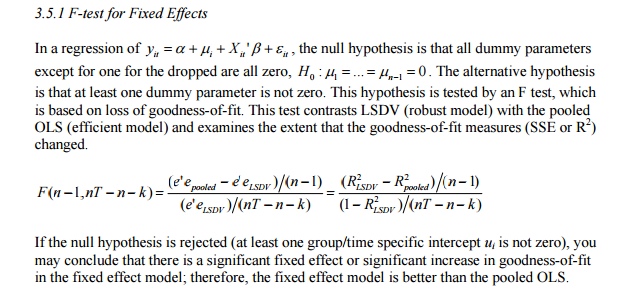
You can check FE vs POLS through this method,

enter image description here

Source: Park, Hun Myoung. 2011. Practical Guides To Panel Data Modeling: A Step-by-step Analysis Using Stata. Tutorial Working Paper. Graduate School of International Relations, International University of Japan

$\endgroup$
1
  • 1
    $\begingroup$ This doesn't really answer the question. $\endgroup$
    – Repmat
    Commented Jan 2, 2016 at 16:39

Your Answer

By clicking “Post Your Answer”, you agree to our terms of service and acknowledge you have read our privacy policy.

Not the answer you're looking for? Browse other questions tagged or ask your own question.