6
$\begingroup$

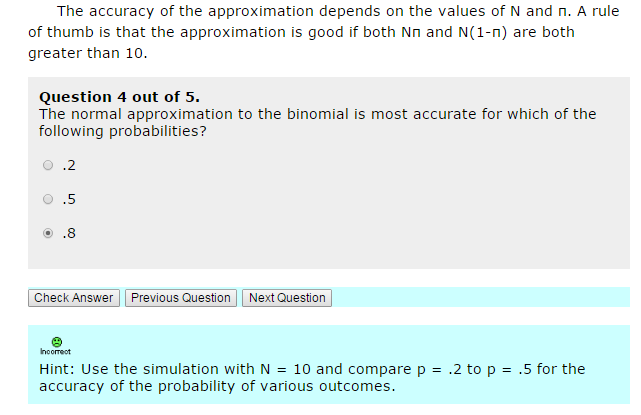
From the Online Stat Book:

enter image description here

I don't understand this:

The accuracy of the approximation depends on the values of N and π. A rule of thumb is that the approximation is good if both Nπ and N(1-π) are both greater than 10.

Let's assume I have an unfair coin, so I get heads with a probability of 0.2. So what? I still can find the mean of the distribution, the SD. I next can find the Z-scores, and then use the normal calculator. Why would the returned probability be less accurate?

$\endgroup$
7
  • $\begingroup$ What is not clear to me is what n and N are. My presumption is that n is the sample size and N would be the population size but this is a problem involving an infinite population. But on the other hand it looks like N and p are the parameters of the binomial distribution. The point of the question relates only to the normal approximation and the sample estimate of p, So consider the sample estimate of p from a sample of size N and calculate its variance when the true parameter is .2 and when it is .5. Which one has the smaller variance. It does not require a simulation to answer it. $\endgroup$ Commented Jan 15, 2017 at 15:09
  • $\begingroup$ But if you do a simulation with p=.2 and N=10 and look at the histogram from repeating the process say 1000 times and do the same for p=.5 you can visually compare the histograms and see which one looks closer to a normal distribution. $\endgroup$ Commented Jan 15, 2017 at 15:12
  • $\begingroup$ @MichaelChernick - I have no Java enabled in my Chrome browser. It looks like this language is not much used nowadays (I'm not that computer savvy, but it looks so to me).. $\endgroup$ Commented Jan 15, 2017 at 16:44
  • $\begingroup$ @MichaelChernick - I found this page that explained the issue to me $\endgroup$ Commented Jan 15, 2017 at 17:21
  • 4
    $\begingroup$ Note that the screen capture makes the Greek letter pi look like an "n." $\endgroup$
    – David Lane
    Commented Jan 15, 2017 at 19:34

2 Answers 2

11
$\begingroup$

NOTE: Following up on @whuber's comment, I realized that I was imposing aesthetic constraints on the plotting of the values in terms of the breaks options in hist(). Running the same simulation with the same seed, a symmetrical illustration is now generated. I believe this addresses the issue.


You may want to refer to this post by Glen_b.

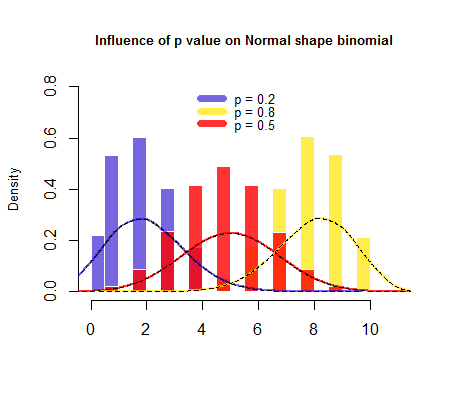
This would be the shape of the simulation:

enter image description here

I ran $100,000$ simulations of random values extracted from a binomial distribution of $10$ trials with a probability of success of the individual Bernoulli experiments of $0.2$, $0.5$ and $0.8$, respectively. Clearly $p=0.5$ approaches a normal distribution much closer, and the more extreme probability values result in markedly skewed distributions.

$\endgroup$
3
  • $\begingroup$ I would just tend to think of the "empirical probability" $\hat{p}=n/N$. This will always equal $p$ in expectation, and it makes it clearer that 0.5 will be the symmetric and "least constrained" case, whereas higher/lower values will tend to have a skewed PDF that will "hit the wall" at right/left (i.e. 1 or 0). $\endgroup$
    – GeoMatt22
    Commented Jan 15, 2017 at 18:22
  • 1
    $\begingroup$ This is an insightful reply (+1). Unfortunately the figure is suspect: the histogram for $p=0.5$ is shifted one-half unit to the left of where it should be, causing a mismatch between it and the plot of the approximating Normal density (which is correctly centered at $0.5$). The histograms for $p=0.2$ and $p=0.8$ are not mirror images of each other, but they ought to be (and their approximating Normal density plots are mirror images). Since you are relying on the figure for your demonstration, it is important to make it accurate. Consider drawing barplots of the Binomial probabilities. $\endgroup$
    – whuber
    Commented Jan 15, 2017 at 21:28
  • $\begingroup$ One thing to keep in mind is that ultimately it's the cdf we are using when we approximate (such as to get a tail area for example). That's not to suggest there's something wrong with this approach, especially for visualization purposes (it's got a long pedigree, for sure going right back to the earliest days). Ultimately one must judge the quality of the approximation for ones own particular purposes by seeing how it behaves; rules of thumb are generally either too strict or not strict enough. They can be a starting point for an investigation of the approximation in some particular instance. $\endgroup$
    – Glen_b
    Commented Jan 16, 2017 at 4:02
3
$\begingroup$

The rule of thumb says that both $N\pi $ and $N(1-\pi)$ should be $>10$. For $\pi=.5$ this demands $N>20$. But for $\pi=0.2$ (as well as for $\pi=0.8$) it demands $N>50$. So we see that the "approximability" kicks in a lot earlier when $p=.5$.

$\endgroup$

Your Answer

By clicking “Post Your Answer”, you agree to our terms of service and acknowledge you have read our privacy policy.

Not the answer you're looking for? Browse other questions tagged or ask your own question.