I am having a time series which shows some kind of periodic behavior looking at the plot. In order to get this seasonal component I am using the rolling mean and use seasonal_decompose of the statsmodels Python library.
sig = df_sensors['S1'].rolling(window=100).mean()[2000:4000].values
decomposed = sm.tsa.seasonal_decompose(sig, freq=4)
As you can see, I am assuming a frequency (freq) of the series of 4 Hz. I am doing this because the FFT of the original data of df_sensors['S1'] shows the following:
So it appears that there are 2 major components. One which is at ~4 Hz and another which is at ~ 175 Hz.
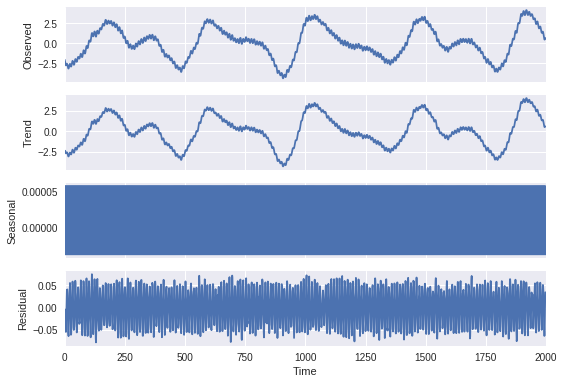
Plotting the result of the decomposition:
decomposed.plot()
shows the following:
As you can see, it is not able to find the actual seasonal part of the signal. You can also see rather long seasons of 4 Hz and the rather fast seasons of 175 Hz in the original signal.
I would like to understand why there was not seasonal component extracted. To the naked eye the behavior looks very seasonal - although there are irregularities.
In the end I would like to try and predict the seasonal behavior but I am a bit stuck here.
Any help would be appreciated and please let me know if you need more information.


freq=500(based on your plot) or something close to this. $\endgroup$