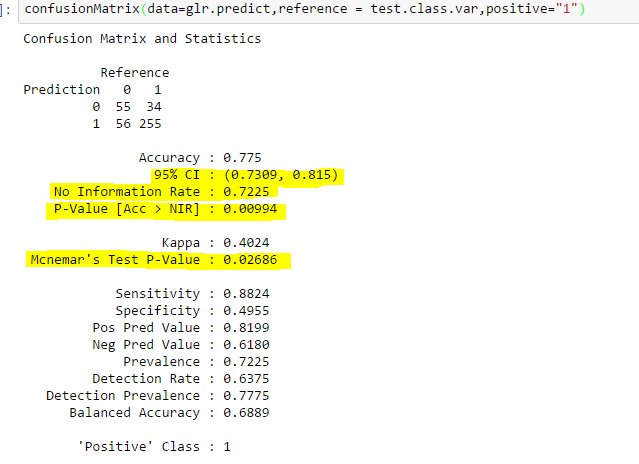
I want know the formulas for the information highlighted in the confusion matrix in the picture below:
2 Answers
library(caret)

mat = matrix(c(55,34,56,255), ncol=2, byrow=TRUE)
mat  # output omitted
confusionMatrix(as.table(mat), positive="B")
# Confusion Matrix and Statistics
#
#     A   B
# A  55  34
# B  56 255
#
#                Accuracy : 0.775
#                  95% CI : (0.7309, 0.815)
#     No Information Rate : 0.7225
#     P-Value [Acc > NIR] : 0.00994
#
#                   Kappa : 0.4024
#  Mcnemar's Test P-Value : 0.02686
#
#             Sensitivity : 0.8824
#             Specificity : 0.4955
#          Pos Pred Value : 0.8199
#          Neg Pred Value : 0.6180
#              Prevalence : 0.7225
#          Detection Rate : 0.6375
#    Detection Prevalence : 0.7775
#       Balanced Accuracy : 0.6889
#
#        'Positive' Class : B
This comes from the caret package in R. It presents a confusion matrix, which is a contingency table of the predicted and actual classes from some classifier, with some information about the confusion matrix that can help you interpret different aspects of the quality of the classifier.
The Accuracy is the proportion of the cases that were classified correctly. You can see that there were 400 cases, and the classifier correctly said A and B (in your case 0 and 1) 55 and 255 times, respectively. Thus, there were 310 correct classifications out of 400 for 77.5% correct. Because each classification is either correct or incorrect, that value is a binomial and we can form a confidence interval for it, just as we can for any other binomial. There are lots of ways to calculate confidence intervals for a binomial.
Because 289 of the 400 cases were in the 'positive' class, you could just say "B" for every cases without fitting any classifier and still get 72.25% correct. That doesn't sound so bad, but in fact, it means you don't know anything relevant to the situation at all, so we want to take that into account. That is called the "no information rate". Before you think your model is accurate, or provides valuable information, you want your accuracy to be greater than that. You might further want to know if your accuracy doesn't just happen to be above that level, but if it is significantly greater than the no information rate. A test of whether an observed proportion is greater than some specified value is a simple one-tailed binomial test. The p-value from which is what the P-Value [Acc > NIR] displays.
That p-value only tells you that your accuracy is better, you may also want to know if your model is biased. That is, does your classifier tend to say B / 1 more often than is really the case? You could test the proportion the model says B against the observed proportion B, but that wouldn't really take the structure of the confusion matrix into account, however. It wouldn't recognize that the underlying data are non-independent, and therefore doesn't deal with the non-independence appropriately (from a statistical point of view). The test that does recognize these things is McNemar's test. I discuss McNemar's test here and here, which you may want to read to get a fuller overview. Your last highlighted line is the p-value from McNemar's test of the confusion matrix.
-
1$\begingroup$ +1 nice to see you answer these types of questions. $\endgroup$ Commented Aug 21, 2017 at 16:48
Wonderful answers given above up to McNemar's test. In the below is to add notes for the rest of the calculations.
====================
Sensitivity : 0.8824
Specificity : 0.4955
Pos Pred Value : 0.8199
Neg Pred Value : 0.6180
Prevalence : 0.7225
Detection Rate : 0.6375
Detection Prevalence : 0.7775
Balanced Accuracy : 0.6889
'Positive' Class : B
====================
Caret's ConfusionMatrix function prints the above type of output. The predicted classes are rows and actual cases are columns.
So the ACTUAL Negative cases are (55+56) 111, and ACTUAL Positive cases are (34+255) 289. The PREDICTED Negative cases are (55+34) 89, and PREDICTED Positive cases are (56+255) 311.
Sensitivity = Rate of True Positives captured by the algorithm (255/289) is 0.882353 (0.8824)
Specificity = Rate of True Negatives captured by the algorithm (55/111) is 0.495495 (0.4955)
In the above we used actual marginal totals for calculating the rates. In the below we will use predicted marginal totals for calculating the rates, for Positive Predictive Value (Pos Pred Value) and Negative Predictive Value(Neg Pred Value).
Pos Pred Value = Rate of Positives captured among the total Pos Predicted, is 255/311 = 0.8199
Neg Pred Value = 55/89 = 0.6180
Prevalence is the the rate of "All ACTUAL Postives" in the whole population = 289/GrandTotal, 289/400 = 0.7225
Detection rate is among total population, how much is detected = 255/400 = 0.6375
Detection prevalence is rate of "All PREDICTED Positives" in the whole population = 311/400 = 0.7775
Balanced Accuracy is the average of Sensitivity and Specificity = (0.882352+0.495495)/2 = 0.6889
Additional notes which are not printed by the Caret's ConfusionMatrix function, but are commonly used are:
Precision is useful in actual targeting plan; we can only act on predicted and so this is useful: Same as Pos Predicted Value = 0.8199
Recall is useful to make judgements about the model and we want to see how much the model is able to recall correctly: Same as Sensitivity = 0.8824
F1: Equally weighted average of Precision and Recall; because these are rates, we have to use harmonic mean. Harmonic mean of Precision and Recall, 2*[Precision+Recall)/(Precision*Recall)] = 2[(0.8199 x 0.8824)/(0.8199 + 0.8824)] = 0.8500


R, this isn't a programming question. The question asks for the formulas used to produce the highlighted information. Those formulas are mathematical &/or statistical in nature. This should be considered on topic here, IMO. $\endgroup$