0
$\begingroup$

I am trying to categorize the functionality of batteries in one kind of device. I am using linear models to find the functionality of batteries over time (considering other variables in the device that uses the battery). Then I get the lm coefficient of battery over time and I am assuming that the batteris functionality should be normally distributed (since it is factory made) which I see it too. The goal is to not only categorize their functionality but also detect anomalies.

I know I can use SVM algorithm to detect the anomalies but I dont think svm is the correct algorithm for it since I know what a good battery should be almost and the distribution is Gaussian. So I decided to categorize batteries :

  1. Good: if lm coefficients are within the 1SD from mean of distribution (n=4266)
  2. Bad: if 1SD < lm Coefficient < 2SD (n=229)
  3. Anomaly: if lm coefficient is less than 2SD (n=160)

I am not sure if this is a naive criteria? What do you think?

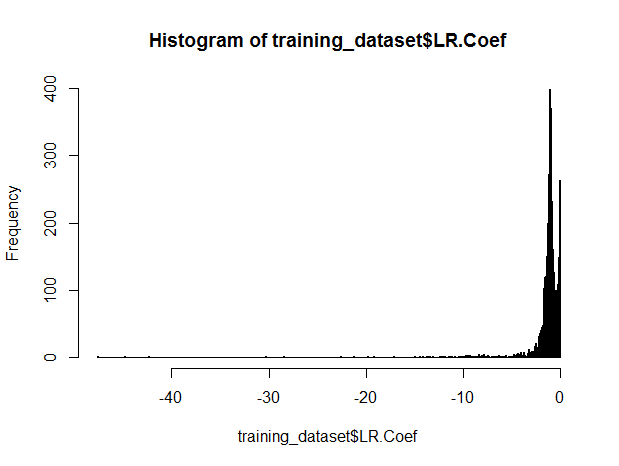
The distribution of LM coefficients

$\endgroup$
8
  • $\begingroup$ What is denoted as SD? If it is standard deviation, you either 1) estimated standard deviation in a non-robust way, or 2) your distribution of lm coefficient is not normal. $\endgroup$ Commented Oct 11, 2017 at 9:12
  • $\begingroup$ Yes it standard deviation. 2) it is skewed but so basically starts from the mean of the normal distribution. But what do you suggest to me to do? $\endgroup$
    – Rozita
    Commented Oct 11, 2017 at 9:20
  • $\begingroup$ How about using probablity function of normal distribution and applying an epsilon to decide which PF is good and which one is anomaly? $\endgroup$
    – Rozita
    Commented Oct 11, 2017 at 9:23
  • $\begingroup$ At first, I would not rely on normality here. If you have 4266 + 229 + 160 points, there should be ~3100 points within the interval of 1SD under normality assumption, not >4000. I would find a probability model that "look alike" your distribution, fit it in a robust way and remove all results that have adjusted p-value < 0.05 (or any other threshold) $\endgroup$ Commented Oct 11, 2017 at 9:29
  • $\begingroup$ upd: your distribution (based on the plot) is not even close to normal. try to find a rationale to use smth like zero-inflated gamma distribution. $\endgroup$ Commented Oct 11, 2017 at 12:32

1 Answer 1

-1
$\begingroup$

Your idea looks good to me. (I was not able to add a comment - hence attempting an 'Answer')

If I understand correctly: Battery performance degrades over time and hence you have a -ve lm coefficients.

Some observations based on the plot:

  • Extremely narrow "bell" - so the SD is probably very small
  • The avg. seems to be about -2.0, and then it has a really long tail.
  • So it appears to me that you will have a lot of "anomalies" based on your guidelines - where as generally shouldn't anomalies be a small percentage?
  • Also there appears to be a hump with coefficient = 0, so I guess those batteries showed a performance that appear flat over time - i.e. NO degradation over time. I wonder if those are due to incorrect data readings? Are those anomalies too? And would your criteria catch them?
$\endgroup$
3
  • $\begingroup$ it does not look like "bell" at all. At first, where is the right tail of the "bell". It is just non-normal data. $\endgroup$ Commented Oct 11, 2017 at 12:40
  • $\begingroup$ @RajeshS no I dont have any criteria about the percentage of the anomalies so it can be as many as I can detect. I should mention some important fact about these batteries that they are being recharged by solar panels so the hump at zero is those that are being recharged almost as much as they are being used. I can first remove those but the problem here is I cannot take care of solar recharging since we dont have any information when and how much it can happen. And we dont care about those anyway since they are not being considered as bad batteries anyway. $\endgroup$
    – Rozita
    Commented Oct 11, 2017 at 12:48
  • $\begingroup$ And I use LOESS smoothing so if the battery level is 100% for a quite several days or if only one day has been recharged, this smoothing method changes the battery level a bit to fit a smooth linear model on top of it. $\endgroup$
    – Rozita
    Commented Oct 11, 2017 at 13:00

Your Answer

By clicking “Post Your Answer”, you agree to our terms of service and acknowledge you have read our privacy policy.

Not the answer you're looking for? Browse other questions tagged or ask your own question.