7
$\begingroup$

I am a newbie to neural network. i am using TensorFlow + Keras to model my neural network for classification of 12 logos. The model has 5 convolution layers.

I have trained a neural network model and got the following results.

with training,
loss = 0.0877   accuracy = 0.9780

with test data
loss = 0.0976   accuracy = 0.9646
  1. Is this model good or does it overfits the data?

  2. And how can i find out whether the model overfits the data or not?

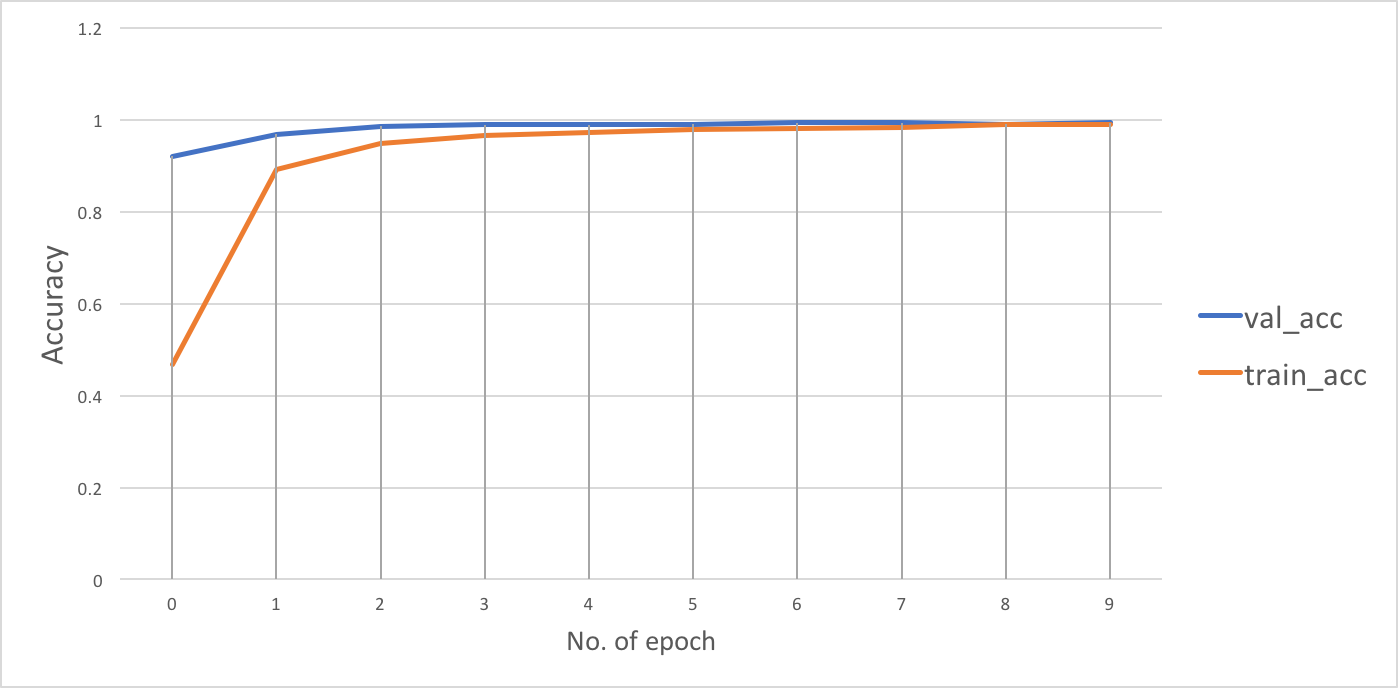
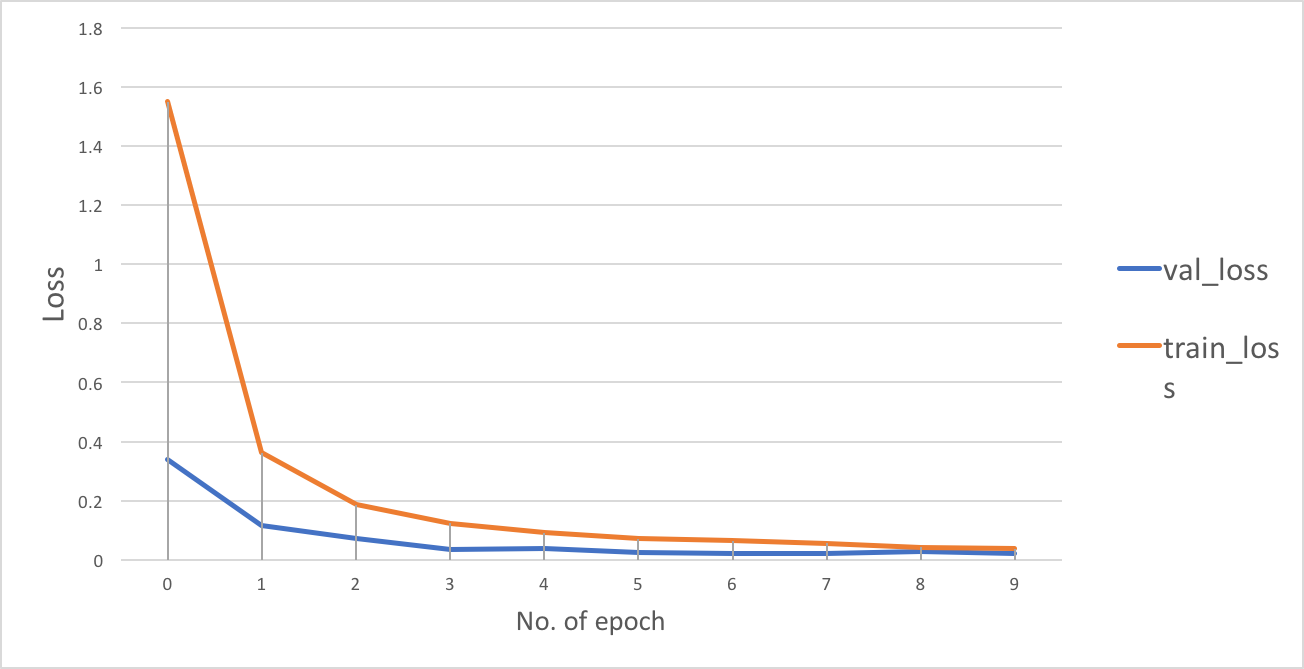
after some help from replies i managed to draw two graphs from tensorboard data. and what funny is that,

  1. val_acc is higher than training_acc
  2. val_loss is lower than training_loss

Loss graph accuracy graph

$\endgroup$

2 Answers 2

5
$\begingroup$

Without knowing a lot more about the model, nor the data used, it is hard to answer these questions with and rigour. That aside, the values you provide would make the think it is a reasonable model and does not necessarily overfit the training data.

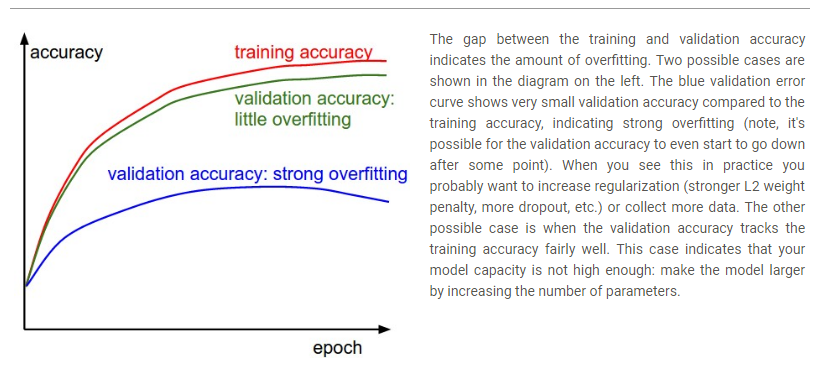
for your second question, my first line of action would always be to plot the training and test accuracy over each epoch (iteration), then look at how the curves develop. I generally hope to see a test curve that shadows the training curve, always a little lower. Here is a diagram with a short explanation taken from the amazing cs231n course from Stanford.

enter image description here

Image source

Course Homepage

All the material and video lectures are freely available and would be a great place for you to improve your understanding whilst working on Deep Learning topics.

$\endgroup$
9
  • $\begingroup$ as i know training data is used to train the model changing its weights and validation set is used to measure accuracy in trained model. so how can i plot a graph with training accuracy and validation accuracy? $\endgroup$
    – Damith Tilakaratne
    Commented Jul 20, 2017 at 10:55
  • $\begingroup$ At each iteration, you can simply save the training and test accuracies, then plot them afterwards. Keras/Tensorflow also have objects that will track such information for you too, if you don't want to do it manually. It can be done with Tensorboard live during training (if you want to make things really cool)... Have a look at this: keras.io/callbacks/#tensorboard $\endgroup$
    – n1k31t4
    Commented Jul 20, 2017 at 11:05
  • $\begingroup$ Just use dropout. Your model will never overfit ever again. $\endgroup$
    – Ricky Han
    Commented Jul 20, 2017 at 21:15
  • $\begingroup$ Dropout is a good way to minimise such effects. There are several variants of it. To improve performance further, there are things like batch normalisation, layer normalisation and n other approaches - where n is large :) $\endgroup$
    – n1k31t4
    Commented Jul 20, 2017 at 21:55
  • $\begingroup$ Why does the green line indicate underfitting? $\endgroup$
    – Akababa
    Commented Dec 26, 2017 at 21:12
2
$\begingroup$

Overfitting is something that happens gradually, so it is sometimes hard to say. Also, whether a model is "good" or not depends a lot on context. If you need 99% accuracy for your model to be used in production then the values are not "good".

However, the values you show for train and test loss, accuracy do not indicate a problem with overfitting to me. It is normal to see a slight drop in performance between training values and test values. Not only that, but is often acceptable to have a bigger difference between train and test provided that test performance is still better than any other test performance.

One important detail missing is the size of the test data. The reported accuracy is only an estimate, and the smaller your test set, the less reliable it is for drawing conclusions from.

For better detection of overfitting you can plot a learning graph of your loss metrics versus epoch number. If you see something like this (From Wikipedia page on Overfitting):
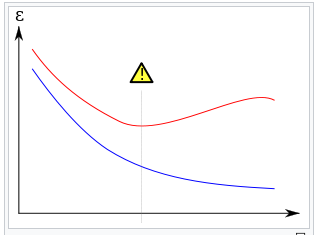
Typical overfit learning graph

where the blue line is your training loss and the red line is your test loss. Then you can see that overfitting has become a problem after the warning sign.

This kind of learning behaviour, with an optimum number of epochs before overfitting occurs, is one reason why early stopping is a common approach in training.

$\endgroup$
7
  • $\begingroup$ in my model it has 10 epoch with a batch size of 32 so for each epoch i can get the training loss while training. but i am no familiar with how to get the test loss for epoch. can you please explain that $\endgroup$
    – Damith Tilakaratne
    Commented Jul 20, 2017 at 10:57
  • $\begingroup$ Keras can output that, you just tell it what test set to use, and what metrics to use. Often in practice this is a 3-way split, train, cross-validation and test, so if you find examples that have a validation or cv set, that is fine to use for the plots too and is a similar example. This example should output train and test metrics on each epoch: github.com/fchollet/keras/blob/master/examples/mnist_mlp.py $\endgroup$ Commented Jul 20, 2017 at 11:33
  • $\begingroup$ E.g. from that example, if I run it I see one line per epoch: 60000/60000 [==============================] - 8s - loss: 0.2456 - acc: 0.9245 - val_loss: 0.1146 - val_acc: 0.9654 - and you can plot the loss as "training loss" and val_loss as "test loss" for a similar graph. The values are also available programatically from the history variable. $\endgroup$ Commented Jul 20, 2017 at 11:35
  • $\begingroup$ in my case it only print out the loss and accuracy how can i print the val_loss and val_accuracy $\endgroup$
    – Damith Tilakaratne
    Commented Jul 20, 2017 at 11:56
  • 1
    $\begingroup$ i found the answer from keras FAQ, they say that, "A Keras model has two modes: training and testing. Regularization mechanisms, such as Dropout and L1/L2 weight regularization, are turned off at testing time. Besides, the training loss is the average of the losses over each batch of training data. Because your model is changing over time, the loss over the first batches of an epoch is generally higher than over the last batches. On the other hand, the testing loss for an epoch is computed using the model as it is at the end of the epoch, resulting in a lower loss." $\endgroup$
    – Damith Tilakaratne
    Commented Jul 21, 2017 at 13:34

Your Answer

By clicking “Post Your Answer”, you agree to our terms of service and acknowledge you have read our privacy policy.

Not the answer you're looking for? Browse other questions tagged or ask your own question.