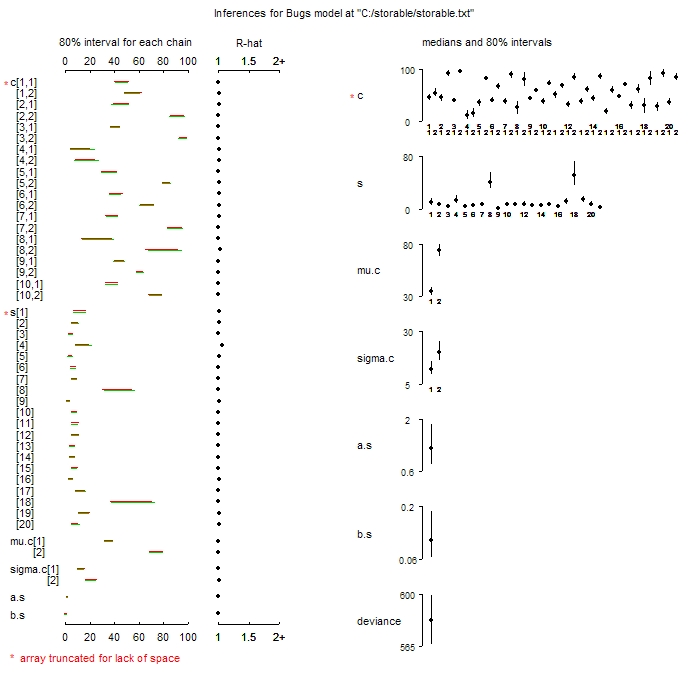
R seems to be able to output nice summary plots from the bugs and jags objects generated by the functions R2WinBUGS::bugs and R2jags:jags.
However, I am using the rjags package. When I try to plot the results of the function rjags::coda.samples using R2WinBUGS::plot.mcmc.list the results are diagnostic plots (parameter density, chain time series, autocorrelation) for each parameter.
Below is the type of plot that I would like to produce, from Andrew Gelman's tutorial "Running WinBuugs and OpenBugs from R". These were produced by using the plot.pugs.
The problem is that plot.bugs takes a bugs object as an argument, while plot.mcmc.list takes the output of coda.samples.
Here is an example (from the coda.samples):
 library(rjags)
 data(LINE)
 LINE$recompile()
 LINE.out <- coda.samples(LINE, c("alpha","beta","sigma"), n.iter=1000)
 plot(LINE.out)
What I need is either
- a way to generate a similar, information-rich, one-page summary plot similar to the one produced by
plot.bugs - a function that will convert
LINE.outto a bugs object or

