3
$\begingroup$

I am doing my project on forecasting and due to I have limited knowledge in ARIMA, I would like to ask what is the appropriate ARIMA model for these two data. Both data are monthly.

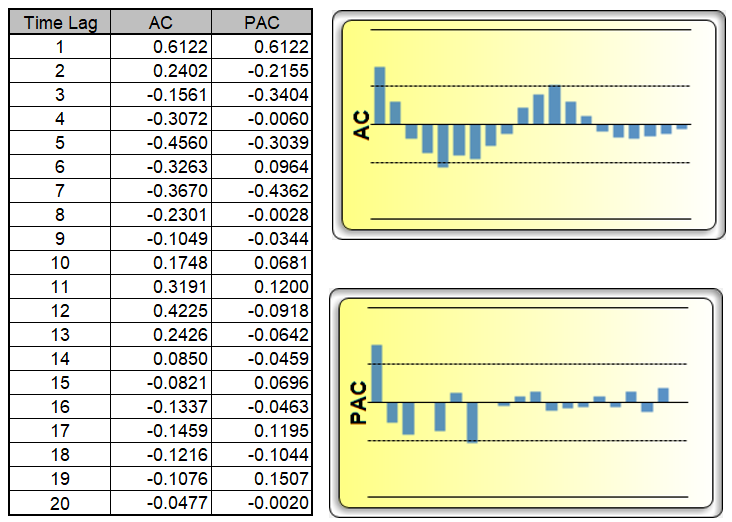
Figure 1

ACF and PACF Plot for Data 1 UNDIFFERENCED

The first data is shown above, i differenced the data once due to stationary problems (as it cuts off slowly, CMIIW), thus the result of differencing is shown below

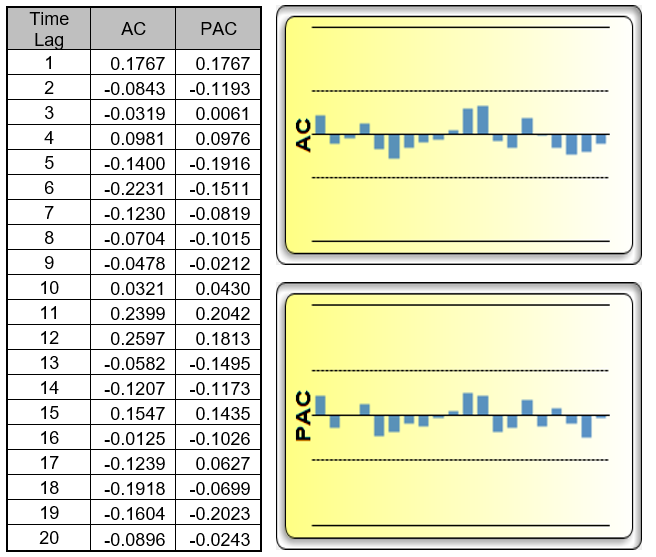
Figure 2

ACF and PACF Plot for Data 1 DIFFERENCED

I have found that the data is under 0.05 on lag 1 and 2. Does it mean that there are 4 available ARIMA model for this data [(1,1,0), (0,1,1), (2,1,0) and (0,1,2)]? I also tried to use ARIMA(1,1,1) but failed since the solution do not converge.


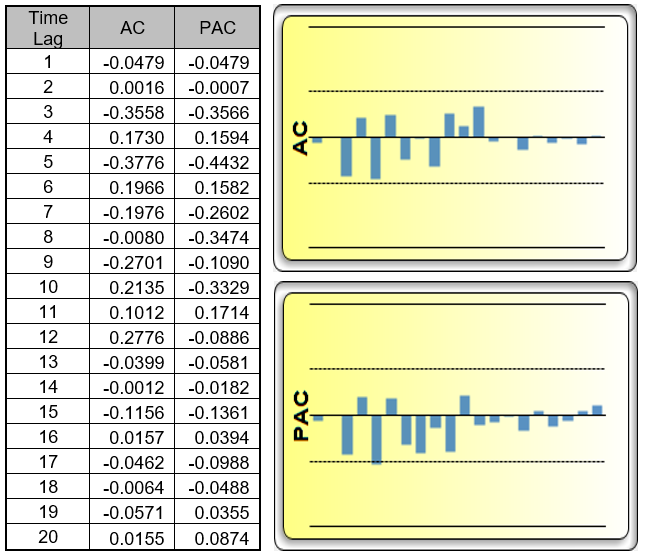
Another one is another data below without differencing (different training data), i found that both ACF and PACF cuts off at lag 3 (with 95% confidence level). Thus are ARIMA(2,0,0) and ARIMA (0,0,2) applicable for this or do i need to do differencing first? The reason i am putting MA(2) and/or AR (2) is that some resources found that the sum of p & q should not exceed 2 to prevent overfitting the model.

Figure 3

ACF and PACF Plot for Data 2

Thank you very much for your help :D
$\endgroup$

1 Answer 1

2
$\begingroup$

The first series could be a (0,0,0)(1,0,0)3 or (0,0,0(0,0,1)3 OR a hybrid deterministic model with with three seasonal pulses reflecting a quarterly effect and possible short term arima structure. Only your data knows for sure as the acf and pacf can be heavily influenced/clouded by pulses , level shifts ,local time trends and other "infections" or "opportunities" . If you wish you can post your data and I will try and help further.

EDITED AFTER RECEIPT OF DATA:

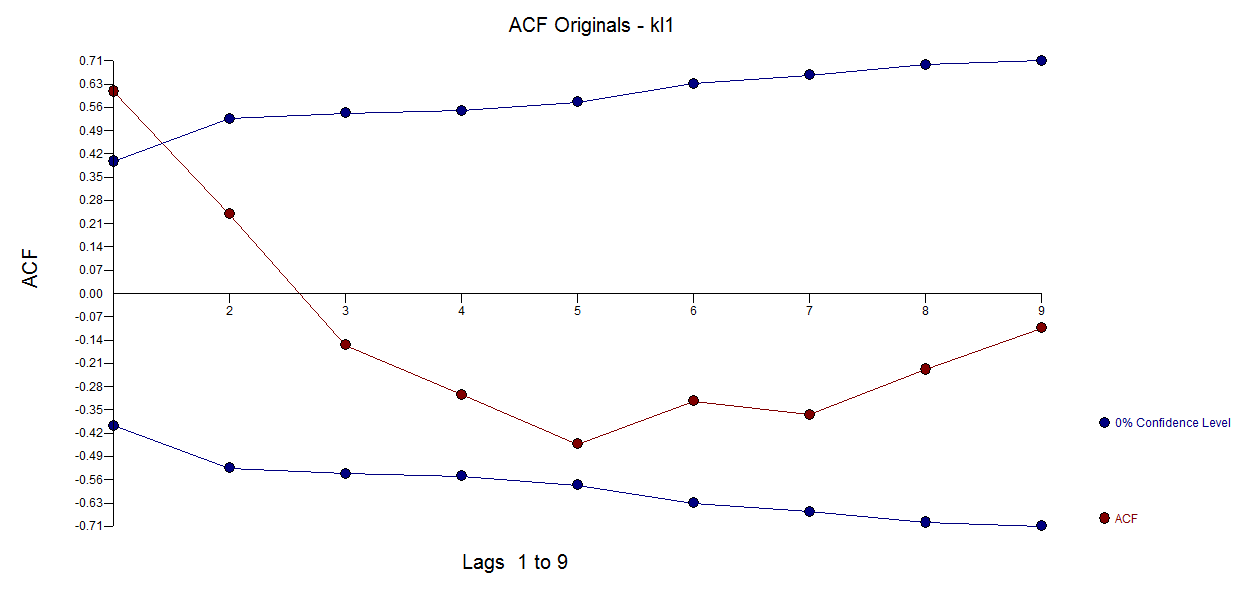
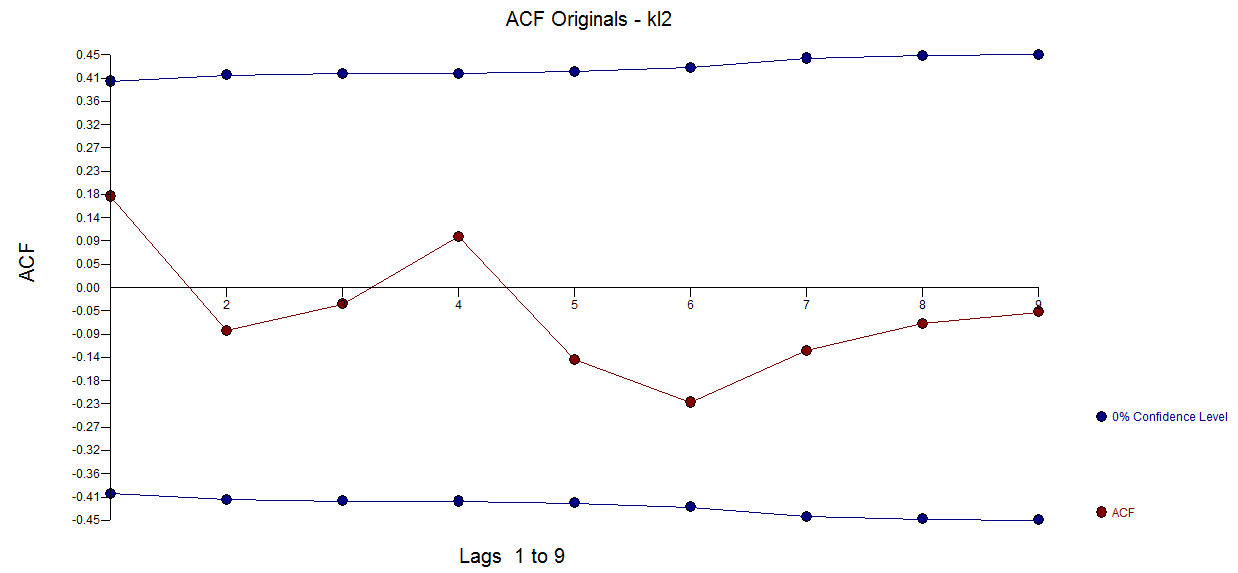
Neither series requires differncing : see the acf of KL1 enter image description here kl2 enter image description here . Unnecessary differencing can inject structure much like rolling in the mud and then washing your shirt.

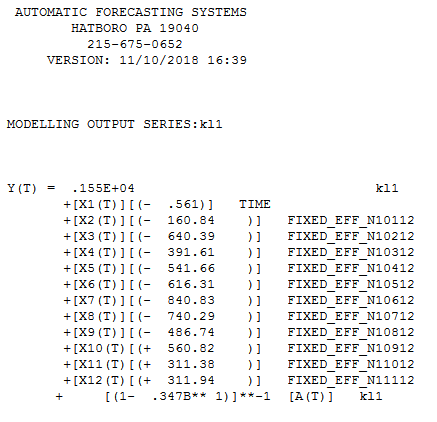
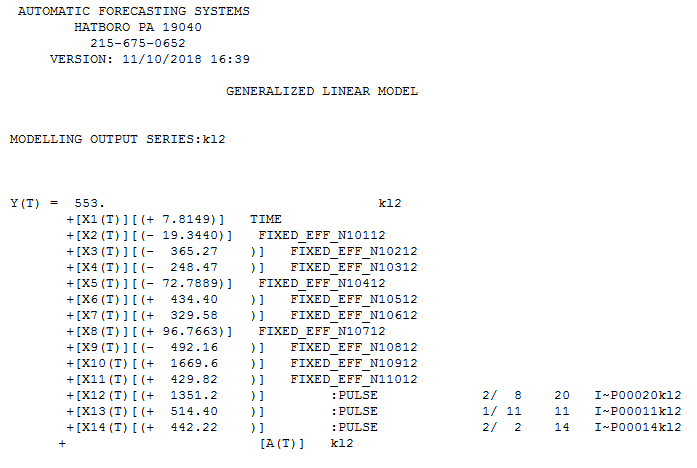
I took your two data sets into AUTOBOX which sorts out the best approach/model to your data .. the model for serenter image description hereies kl1 is and series kl2 here enter image description here

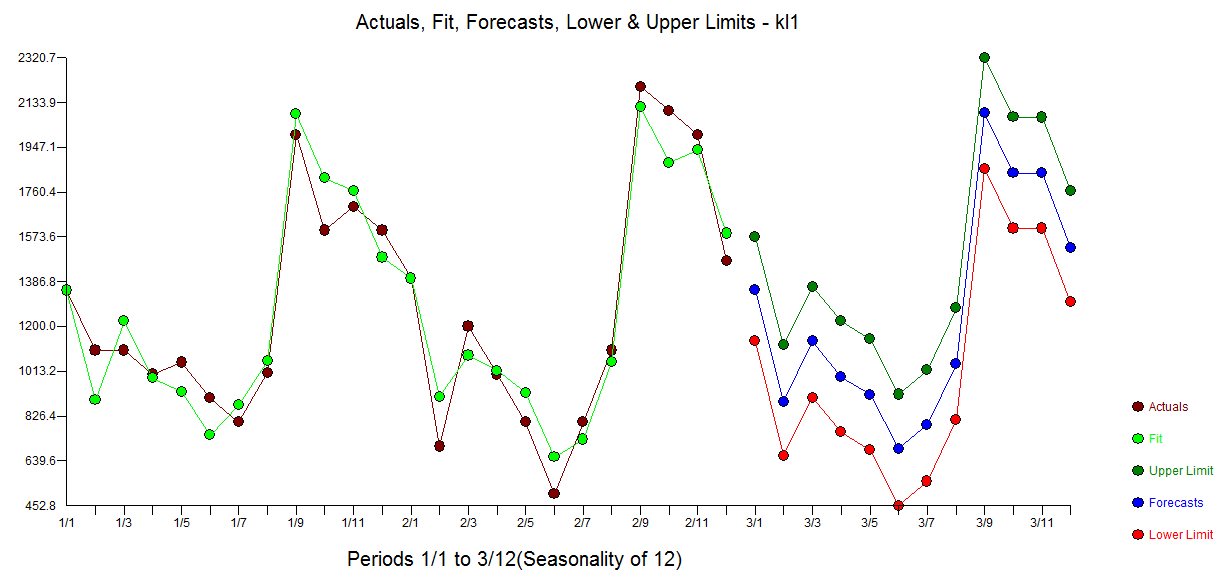
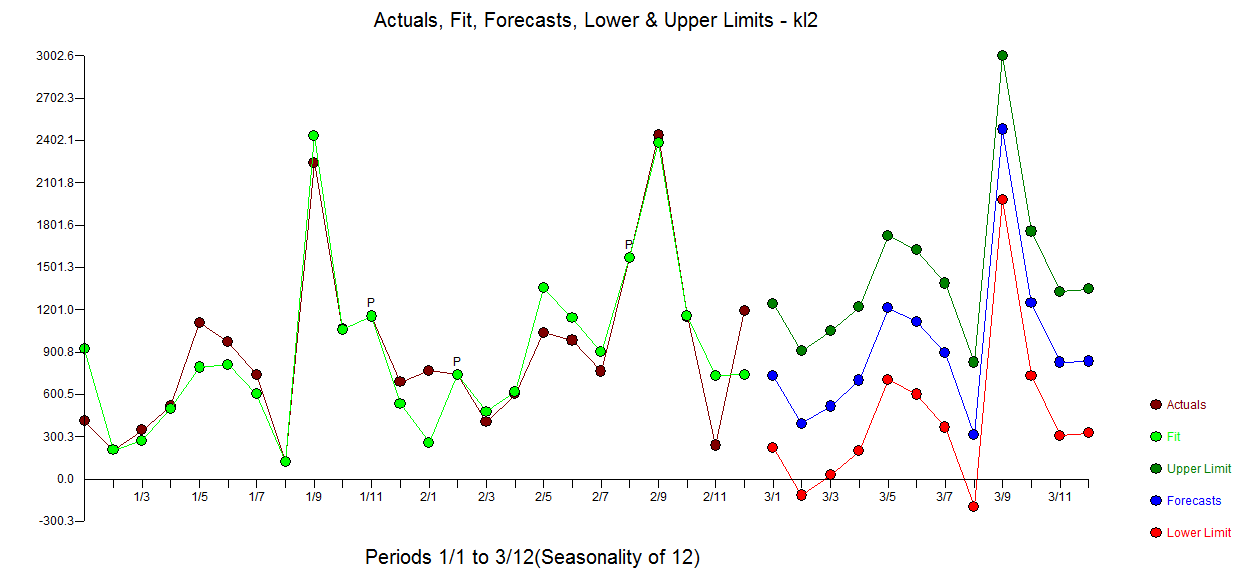
The Actual/Fit and Forecast graph for kl1 is here enter image description here and for kl2 is here enter image description here

Both series had trend , additive seasonal factors while kl1 had an arima component (1,0,0) and kl2 had three pulses and an evidented error variance change suggesting that weighted least squares be employed ( see http://docplayer.net/12080848-Outliers-level-shifts-and-variance-changes-in-time-series.html ) for a discussion of both Intervention DEtection and Error Variance Deterministic Changes.

SARIMA approaches though usually useful when integrated with deterministic structure is often the preferred route but you had too few observations(24) to pursue this approach.

When following other writers , make sure that they were employing best practices .. which unfortunately is not always the case due to either lack of subject knowledge or lack of software or both.

$\endgroup$
4
  • $\begingroup$ Hi, I believe that the model above is SARIMA, right? The first series has been differenced once, so should the d value be 1? FYI, I'm pursuing a master thesis which focusing on several forecasting method including moving average, exponential smoothing, seasonal and holt-winter's, and ARIMA for several fast-moving inventory items. For now i may not touch SARIMA since i have established limitations, maybe if i pursue deeper study on this i'll touch on that. With all due respect, is it possible to adapt those data to ARIMA? I'd like to post the data here but i don't know how. Thank you very much. $\endgroup$
    – komtugeder
    Commented Nov 11, 2018 at 15:07
  • $\begingroup$ Sorry for another comment here due to the maximum characters per comment. Another question from me is that how to correctly determine the p and q value based on lags? For the first series, is it ARIMA(1,1,0) and ARIMA(0,1,1) since it cuts off AT the second lag (AFTER the first lag) or ARIMA(1,1,0) and ARIMA(0,1,1) since it cuts off AT the first lag (AFTER lag 0)? If the earlier is correct, thus there is no ARIMA(2,1,0) and ARIMA (0,1,2) due to no cut off AT third lag (AFTER second lag)? I consider using confidence level of 95% for this forecast. Thank you once again $\endgroup$
    – komtugeder
    Commented Nov 11, 2018 at 15:34
  • $\begingroup$ you can use dropbox or email them to me $\endgroup$
    – IrishStat
    Commented Nov 11, 2018 at 17:31
  • $\begingroup$ If you are happy with my answer ...accept it and close the question. $\endgroup$
    – IrishStat
    Commented Nov 14, 2018 at 11:37

Your Answer

By clicking “Post Your Answer”, you agree to our terms of service and acknowledge you have read our privacy policy.

Not the answer you're looking for? Browse other questions tagged or ask your own question.