3
$\begingroup$

I am using a toy example to explain power calculations for a t-test

Let's say we have two populations where we measure a certain parameter. Population A has a mean of 0 and population B has a mean of 3, both with a sd of 2. The effect size is 1.5

I use the pwr package in R to do the power calculation as such

library(pwr)

pwr.t.test(n = NULL, d = 2/3, sig.level = 0.05,
           power = 0.9, type = "two.sample",
           alternative = "two.sided")

Two-sample t test power calculation 

          n = 48.26427
          d = 0.6666667
  sig.level = 0.05
      power = 0.9
alternative = two.sided

NOTE: n is number in *each* group

So, R is suggesting 48 observations per group, to get a power of 0.9

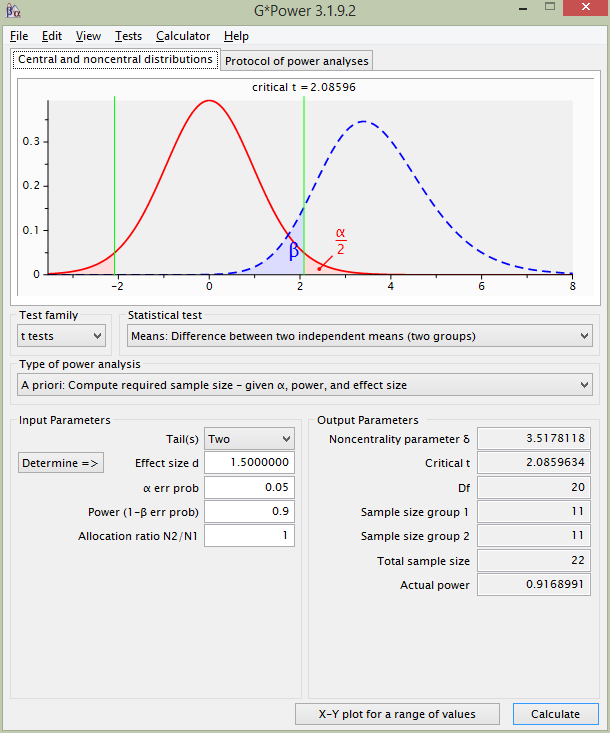
If I repeat the calculation using G*Power, however, I get this, which suggests 11 observations per group!

G*Power t-test power calculation

Finally, if I use this online tool from the University of British Columbia I get 10.

I can understand that rounding errors may bring you from 10 to 11... but why is R giving me such a high value?

Indeed, if I do a little simulation, it looks like 10 or 11 observation give you a power of ~90%

n <- 10

res <- sapply(1:1000, function(x)
  {
  a <- rnorm(n, 0, 2)
  b <- rnorm(n, 3, 2)
  res <- t.test(a, b, alternative = "two.sided")
  res$p.value
  })

table(res<=0.05)

FALSE  TRUE 
  115   885    <-- 88.5% power

n = 48 always gives me a power of 100%... am I missing something?

$\endgroup$
2
  • 1
    $\begingroup$ In R, you use an effect size of 2/3 = 0.66 whereas in G*Power you use 1.5. If you use $d=1.5$ in pwr.t.test, I get an n of $10.4$ which, rounded up is $11$ and coincides with G*Power. $\endgroup$ Commented Apr 25, 2019 at 11:30
  • 1
    $\begingroup$ +1 for a very nicely written question. $\endgroup$ Commented Apr 25, 2019 at 11:32

1 Answer 1

3
$\begingroup$

In your example using R, you're using an effect size of $d=2/3\approx0.6667$ whereas in G*Power, you're using an effect size of $d=1.5$. Repeating the calculations in R using an effect size of $1.5$ results in comparable results:

library(pwr)

pwr.t.test(n = NULL, d = 3/2, sig.level = 0.05,
           power = 0.9, type = "two.sample",
           alternative = "two.sided")

     Two-sample t test power calculation 

              n = 10.40147
              d = 1.5
      sig.level = 0.05
          power = 0.9
    alternative = two.sided

NOTE: n is number in *each* group

As you would round the sample size up, both R and G*Power suggest using a sample size of $11$ per group.

$\endgroup$
1
  • 1
    $\begingroup$ I knew it was a silly mistake! I wrote 2/3 instead of 3/2... thank you for spotting that! $\endgroup$
    – nico
    Commented Apr 25, 2019 at 11:46

Your Answer

By clicking “Post Your Answer”, you agree to our terms of service and acknowledge you have read our privacy policy.

Not the answer you're looking for? Browse other questions tagged or ask your own question.