2
$\begingroup$

I have a collection of data points, which are counts as a function of length. Each data point is the result of many trials and has an error bar. The function Counts(length) is unknown.
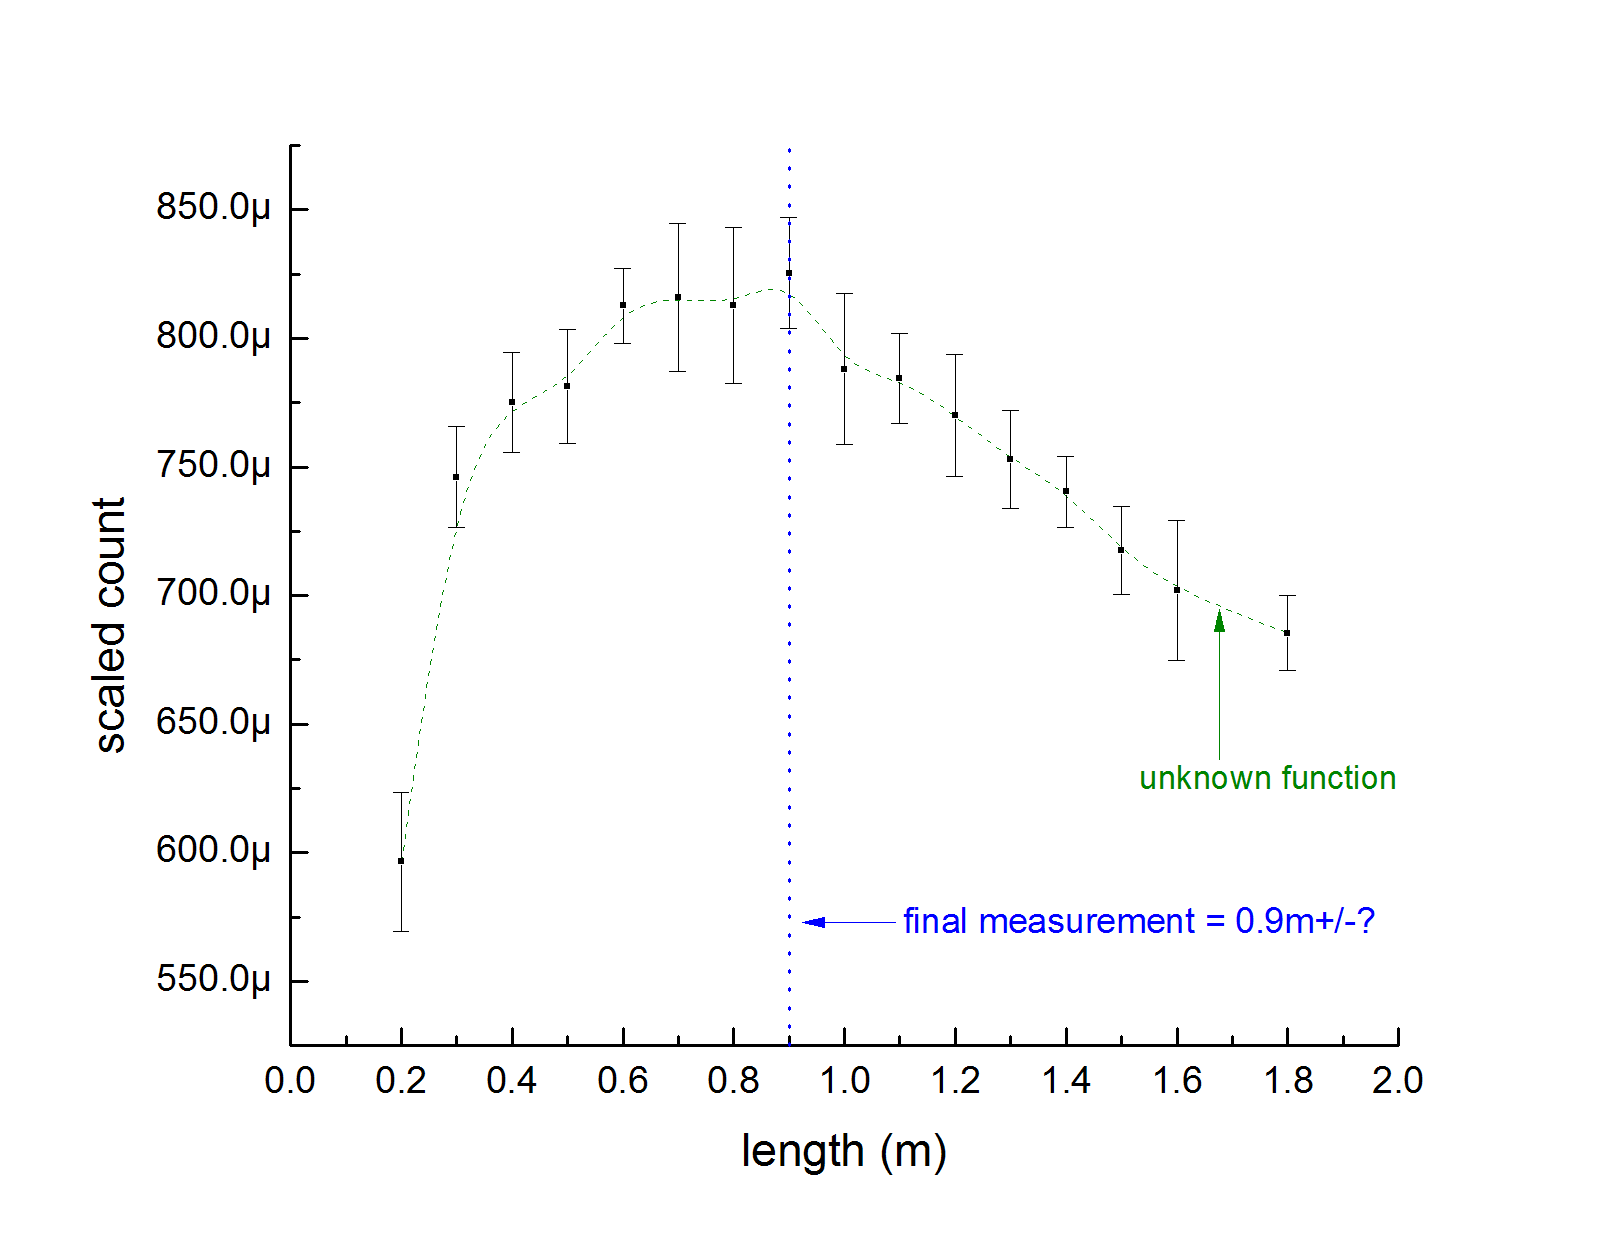
enter image description here

In the end the measurement that I need to quote is the length $X_m$ at which counts are a maximum (so in this case $X_m=0.9m$). Since the data are noisy, there is an uncertainty associated with $X_m$ (i.e., $X_m$ looks like it could be 0.6m-1m). If I knew the function that described these data then I could get an error on the fit parameters, but I have no information on what the function should be, so how to extract an uncertainty? I suppose I could create a hundred data sets like this, find the $X_m$ for each one and find the uncertainty that way, but it seems like that method ignores the information given by the error bars on all the points.

Is there a formalism for figuring out the uncertainty on a parameter of an unknown function?

$\endgroup$
3
  • $\begingroup$ If you go to edit your post, there's a little button right above the text box that lets you select a picture from either your computer or the internet to include. That might make it a bit easier to understand what you're trying to do. $\endgroup$ Commented Jan 16, 2013 at 0:16
  • $\begingroup$ @Jonathan- yes, I would like to add an image, but I am too new to the site, so the spam precautions won't let me. $\endgroup$
    – a yam
    Commented Jan 16, 2013 at 0:26
  • $\begingroup$ Oh, I see. If you upload it to imgur (or another website) and post the URL I (or someone else) can edit it in for you. $\endgroup$ Commented Jan 16, 2013 at 0:40

1 Answer 1

1
$\begingroup$

Sampling is exactly what I would do here. Let's do an example in R. First, we create some toy data and plot them:

set.seed(1)
foo <- data.frame(x=1:10,
  means=10-(1:10-5)^2,
  lwr=10-(1:10-5)^2-5*runif(10),
  upr=10-(1:10-5)^2+5*runif(10))
plot(foo$x,foo$means,ylim=c(min(foo$lwr),max(foo$upr)),type="o",xlab="",ylab="")
for ( ii in 1:nrow(foo) ) lines(x=foo$x[rep(ii,2)],y=c(foo$lwr[ii],foo$upr[ii]))

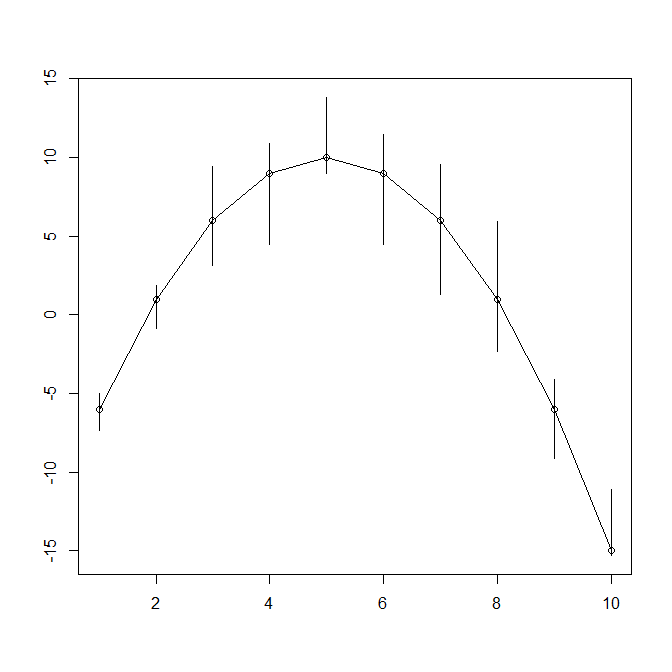
So this is our data:

enter image description here

Now we sample possible realizations at each $X_m$. For this, we would need to understand the specific meaning of your error bars (are they standard errors of the mean for a normal distribution? If so, we would need the number of observations they are based on to assess the standard deviations of the actual underlying observations). For simplicity, I will work here with the interpretation "actual observations are uniformly distributed in the interval given by the error bar". We sample:

nn <- 10000
random.samples <- matrix(runif(nn*nrow(foo),min=foo$lwr,max=foo$upr),
  ncol=nn,byrow=FALSE)

The samples all lie within the error bars, which is good:

apply(random.samples,1,range)

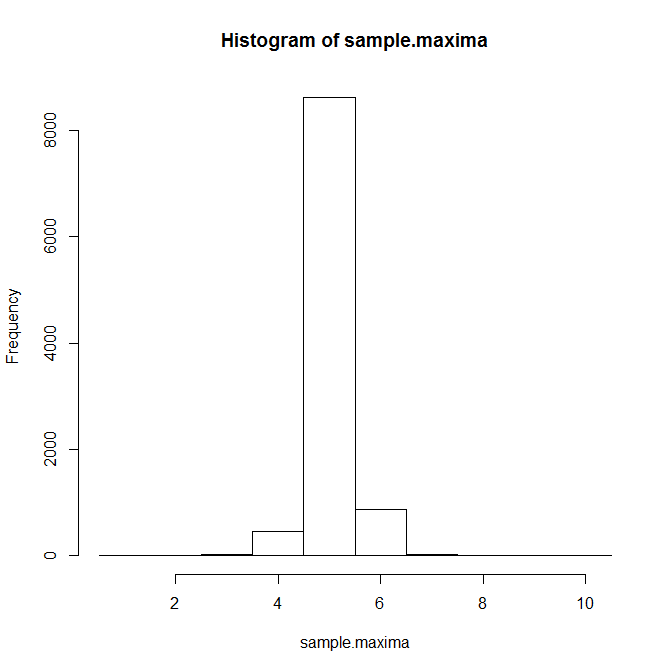
And now we can look at the properties of our sample. For instance, we can count how often each $X_m$ was the maximum of that particular sample and plot a histogram:

sample.maxima <- apply(random.samples,2,which.max)
hist(sample.maxima,breaks=seq(min(foo$x)-.5,max(foo$x)+.5,by=1))

enter image description here

Or we could calculate the mean and standard deviation of the sampled maxima. Alternatively, we could fit a curve to the maximum... or first fit a curve to each sampled vector of observations (making use of any functional relationship we know to hold between your $X_m$ and your counts), then extract the maximum of that fitted curve and analyse the distributions of those curve maximums... or whatever else makes sense in the context of your investigation.

$\endgroup$
2
  • $\begingroup$ Sampling worked beautifully, thank you! About fitting- since the functional form is unknown, would not an uncertainty extracted in this way be meaningless, since it would just be a reflection of the number of parameters used in the fitting? $\endgroup$
    – a yam
    Commented Jan 16, 2013 at 19:39
  • $\begingroup$ If the functional form is completely unknown, then you certainly have a point. It kind of depends on what you know about your data. If you do want to look at fitting curves, you may want to look up so-called natural splines or restricted splines, which are designed to be pretty flexible while avoiding overfitting. $\endgroup$ Commented Jan 16, 2013 at 20:40

Your Answer

By clicking “Post Your Answer”, you agree to our terms of service and acknowledge you have read our privacy policy.

Not the answer you're looking for? Browse other questions tagged or ask your own question.