8
$\begingroup$

The data consist of optical spectra (light intensity against frequency) recorded at varying times. The points were acquired on a regular grid in x (time) , y (frequency). In order to analyse the time evolution at specific frequencies (a fast rise, followed by an exponential decay), I would like to remove some of the noise present in the data. This noise, for a fixed frequency, can probably be modelled as random with gaussian distribution. At a fixed time, however, the data shows a different kind of noise, with large spurious spikes and fast oscillations (+ random gaussian noise). As far as I can imagine the noise along the two axes should be uncorrelated as it has different physical origins.

What would be a reasonable procedure to smooth the data? The goal is not to distort the data, but remove "obvious" noisy artefacts. (and can over-smoothing be tuned/quantified?) I don't know if smoothing along one direction independently of the other makes sense, or if it's better to smooth in 2D.

I've read things about 2D kernel density estimate, 2D polynomial / spline interpolation, etc. but I'm not familiar with the jargon or the underlying statistical theory.

I use R, for which I see many packages that seem related (MASS (kde2), fields (smooth.2d), etc.) but I cannot find much advice on which technique to apply here.

I'm happy to learn more, if you have specific references to point me to (I hear MASS would be a good book, but perhaps too technical for a non-statistician).

Edit: Here's a dummy spectrogram representative of the data, with slices along the time and wavelength dimensions.
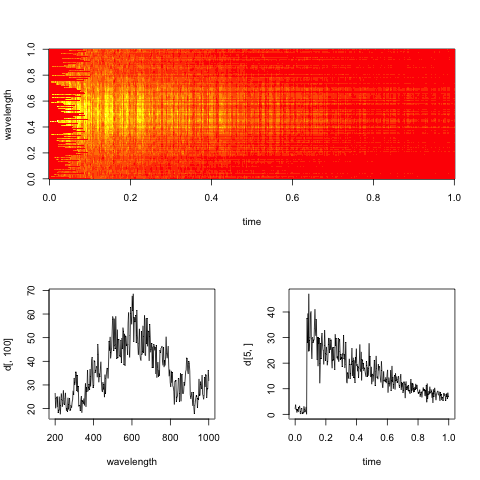
image2d

The practical goal here is to evaluate the exponential decay rate in time for each wavelength (or bins, if too noisy).

$\endgroup$
11
  • $\begingroup$ How many frequencies were measurements taken at? If it's not a large number, might it be practical to see this as a set of individual (but related) time series, one for each specific frequency? $\endgroup$ Commented Jan 25, 2013 at 21:21
  • $\begingroup$ @PeterEllis a large number (say 500, but for the sake of generality it could be even larger) $\endgroup$
    – baptiste
    Commented Jan 25, 2013 at 21:23
  • $\begingroup$ My hunch is to treat them as 500+ correlated time series and use time series techniques like moving average or exponential smoothing; and only use 2d smoothing afterwards and only if necessary for a stylised graphical representation. I don't have enough backing this up however to turn it into a proper "answer". $\endgroup$ Commented Jan 25, 2013 at 21:40
  • 1
    $\begingroup$ I'd look into 'robust' methods. These methods try to de-weight outliers. E.g. there is a robust spline algorithm in R. $\endgroup$
    – user12719
    Commented Jan 25, 2013 at 22:39
  • $\begingroup$ is there something specific to the time variable that makes time series a particular type of statistical analysis? $\endgroup$
    – baptiste
    Commented Jan 26, 2013 at 4:02

5 Answers 5

4
+50
$\begingroup$

You need a to specify a model that separates the signal from the noise.

There is the component of noise at the measurement level that you assume gaussian. The other components, dependent across measurements:

  • "This noise, for a fixed frequency, can probably be modelled as random with gaussian distribution". Needs clarification — is the noise component common to all timepoints, given the frequency? Is the standard deviation same for all frequencies? Etc.

  • "At a fixed time, however, the data shows a different kind of noise, with large spurious spikes and fast oscillations" How do you separate that from the signal, for assumably you are interested on variation of the intensity across the frequency. Is the interesting variation somehow different from the uninteresting variation, and if so, how?

Spurious oscillatioins or non-gaussian noise in general is not a big problem, if you have a realistic idea of its characteristics. It can be modeled by transforming the data (and then using a gaussian model) or by explicitly using a non-gaussian error distribution. Modeling noise that is correlated over measurements is more challenging.

Depending on how your noise and data model are, you might be able to model the data with a general-purpose tool like the GAMs in the mgcv package, or you may need a more flexible tool, which easily leads to a quite customized bayesian setup. There are tools for such models, but if you are not a statistician, learning to use them will take a while.

I guess either a solution specific to spectral analysis or the mgcv package are your best bets.

$\endgroup$
2
  • $\begingroup$ Sound advice, thanks, I need to have a look at these options and think more carefully about the description of the noise. $\endgroup$
    – baptiste
    Commented Feb 1, 2013 at 4:03
  • 1
    $\begingroup$ Noise in optical spectra usually depends on the intensity of the measured light ("counting" Photons is a Poisson process) and often also on the wavelength/frequency (because of detector characteristics). There is a whole bunch of processes contributing instrumental noise, see e.g. Skoog & Leary: Principles of Instrumental Analysis. The predominant type of noise will depend on the type of instrument (and the experiment). The d over time plot shows a clear dependence on the magnitude, suggesting that Baptiste has intensity measurements (as opposed to, e.g. absorbance spectra). $\endgroup$
    – cbeleites
    Commented Feb 1, 2013 at 8:43
2
$\begingroup$

A time series of spectra suggests to me a kinetics experiment, and there is a well-established amount of chemometric literature about this.

What do you know about the spectra? What type of spectra are they? Can you reasonably expect that you have only two species, educt and product?

Can you reasonably assume bilinearity, i.e. the measured spectra $\mathbf X$ at a given time are a linear combination of the component concentrations $\mathbf C$ times the pure component spectra $\mathbf S$:

$\mathbf X^{(nspc \times nwl)} = \mathbf C^{(nspc \times ncomp)} \mathbf S^{(ncomp \times nwl)}$

You say that you want to estimate an exponential decay (in the concentrations). This together with bilinearity suggests to me multivariate curve resolution (MCR). This is a technique that allows you to use information you have (e.g. pure component spectra of some substances, or assumptions on the concentration behaviour like the exponential decay) during model fitting.

As far as I know, it is quite common to smooth the concentrations according to some, e.g. kinetic, model but it is far less common to smooth the spectra. However, the algorithm allows to do so. I asked Anna in summer whether they impose smoothness constraints, but she told me they don't (and good spectroscopists hate smoothing instead of measuring good spectra ;-) ). Often, it is not needed, neither, because aggregating the information from all the spectra will already yield good estimates of the pure component spectra.

I did smooth "component spectra" (in fact, principal components) twice lately (Dochow et al.: Raman-on-chip device and detection fibres with fibre Bragg grating for analysis of solutions and particles, LabChip, 2013 and Dochow el al.: Quartz microfluidic chip for tumour cell identification by Raman spectroscopy in combination with optical traps, AnalBioanalChem, accepted) but in these cases my spectroscopic knowledge told me that I'm allowed to do this. I quite regularly apply a downsampling and smoothing interpolation to my Raman spectra (hyperSpec::spc.loess).

How to know what is too much smoothing? I think the only possible answer is "expert knowledge about the type of spectroscopy and experiment".


edit: I reread the question, and you say you want to estimate the decay at each wavelength. However, is that true or do you want to estimate the decay of different species with overlapping spectra?

$\endgroup$
2
  • $\begingroup$ Thanks for the references. Although the sample doesn't really have two species, it is somewhat similar (two distinct physical processes to distinguish). I will have a closer look when I get back from a conference. $\endgroup$
    – baptiste
    Commented Feb 1, 2013 at 4:01
  • $\begingroup$ @baptiste: Have a good conference. Do you mind to tell what kind of processes you have? I.e. can you assume that "within" each process the spectral characteristics are the same, or can the oscillations "move" over the spectrum (frequency is ambiguous if you have an oscillation pattern in a spectrum)? $\endgroup$
    – cbeleites
    Commented Feb 1, 2013 at 8:22
1
$\begingroup$

The data consist of optical spectra (light intensity against frequency) recorded at >varying times. The points were acquired on a regular grid in x (time) , y (frequency).

To me, this sounds very much like a case for functional data analysis (FDA), although I have no idea of the physics behind your problem, and I might be completely wrong. If you can consider the process behind your data to be inherently smooth and continuous, you might want to use a bivariate basis function expansion to capture your measurements in the form $intensity = f(time, frequency)$, with $f$ being a sum of basis functions (e.g. b-splines) and coefficients. A limited set of basis functions directly reduces roughness and therefore cancels a good part of white noise.

I've read things about 2D kernel density estimate, 2D polynomial / spline interpolation, etc.

...

I use R, for which I see many packages that seem related (MASS (kde2), fields (smooth.2d), etc.) but I cannot find much advice on which technique to apply here.

You mentioned spline interpolation, but didn't mention the fda package which implements pretty nicely and easily accessible the basis function expansion I mentioned above. The set of simultaneous measurements for time, frequency and intensity (ordered as a threedimensional array) could be captured as one bivariate functional data object, see. e.g. the function 'Data2fd'. Moreover, several smoothing procedures are available in the package which are all designed to cancel white noise or "roughness" in measurements of inherently smooth processes.

The Wikipedia article phrases the problem of white noise in FDA as follows:

The data may be so accurate that error can be ignored, may be subject to substantial measurement error, or even have a complex indirect relationship to the curve that they define. ... daily records of precipitation at a weather station are so variable as to require careful and sophisticated analyses in order to extract something like a mean precipitation curve.

FDA provide the tools for these cases. Doesn't this translate to your case?

...but I'm not familiar with the jargon or the underlying statistical theory...

...but I cannot find much advice on which technique to apply here...

Concerning fda: I wasn't neither but the book of Ramsay and Silverman on FDA (2005) makes the basics very well accessible and Ramsay Hooker and Graves (2009) directly translate the insights from the book into R code. Both volumes should be available as e-books in a university library for statistics, biosciences, climatology or psychology. Google will also bring up some more links that I can't post alltogether here.

Sorry that I can not provide a more direct solution for your problem. However, FDA did help me a lot once I figured out what it is for.

$\endgroup$
3
  • $\begingroup$ that's helpful thanks. I was hoping to hear a more global perspective than just one particular technique, but if that's the one I should use it's all good. $\endgroup$
    – baptiste
    Commented Jan 29, 2013 at 7:01
  • $\begingroup$ Thanks for the credit. Finally, no one but youself or your immediate colleagues migth be able to decide what is the appropriate methodology. But In light of what you described I would take a look on FDA in general. It might give you some more ideas how to analyze your data. $\endgroup$ Commented Jan 29, 2013 at 10:20
  • $\begingroup$ @user1966337: FYI, in optical spectroscopy, the intensities at distinct wavelengths often have distinct meaning, so you can treat them as variates for a (physically meaningful) bilinear model with few components, leading to a more restricted model of the data. Sometimes you have effects though that do not allow this and where FDA would be more appropriate. $\endgroup$
    – cbeleites
    Commented Jan 31, 2013 at 11:18
1
$\begingroup$

Being a simple physicist, not a statistics expert, I'd take a simple approach. The two dimensions are of different natures. It would make sense to smooth along time with one algorithm, and smooth along wavelength with another.

The actual algorithms I'd use: for wavelength, Savitzky-Golay with a higher order, 6 maybe 8.

Along time, if that example is typical, that sudden jump up and more or less exponential decline make it tricky. I've had experimental data, and noisy images, just like that. If simple straightforward methods don't help enough, try a Gaussian smoother but suppress its effect near the jump, as detected by an edge detector. Smooth and broaden the edge detector's output, normalize it to go from 0.0 to 1.0, and use it to select between the original image and the Gaussian-smoothed one, pixel by pixel.

$\endgroup$
0
$\begingroup$

@baptiste: I'm glad you added the plot like I suggested. It does help a lot:

So, if I understand correctly, your practical goal is to evaluate the exponential decay rate for each wavelength; then let's do just that! Define a function you want to minimize for each wavelength separately, and minimize it.

Let's look at a single given wavelength, like in your lower right plot.

First, for simplicity, let's throw away all of the values prior to 0.2 seconds, because they contain a massive discontinuity (our approach can be augmented to deal with that later). Then, define the following optimization criterion, which aims to find the decay constant $\tau$:

$$ \hat\tau = arg min_{\tau} \sum_{t_i}||e^{-t_i/\tau }- d_i||^2 $$

You can solve this optimization problem analytically by differentiating w.r.t $\tau$, equating to zero, and solving for $\tau$; or you can use a solver.

Later, if you believe that adjacent wavelength should have similar decay constants, you can incorporate this into a more elaborate optimization criterion.

If anything, I would suggest you read an optimization must-read book: Boyd's convex optimization.

Hope this helps!

$\endgroup$
1
  • $\begingroup$ sorry but there seems to be a misunderstanding: I'm familiar with nonlinear optimisation; here I would like to know what smoothing techniques I can use on such data when fitting at every wavelength is not reliable because of the noise in both dimensions. Granted, my dummy example seems pretty workable, but if I'd added more noise it would have been harder to visualise. I like the fda approach suggested earlier, as it encompasses both the fitting part and the smoothing in one methodology. $\endgroup$
    – baptiste
    Commented Jan 31, 2013 at 9:19

Your Answer

By clicking “Post Your Answer”, you agree to our terms of service and acknowledge you have read our privacy policy.

Not the answer you're looking for? Browse other questions tagged or ask your own question.