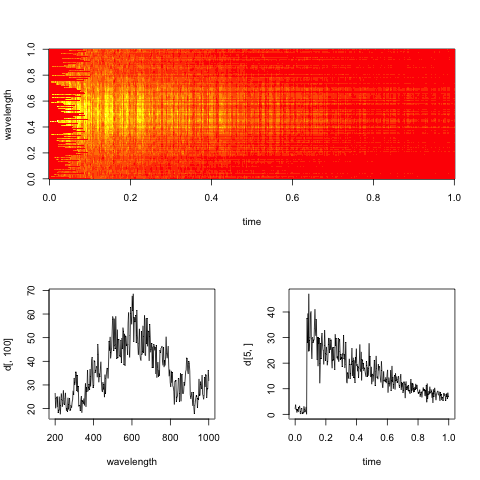
The data consist of optical spectra (light intensity against frequency) recorded at varying times. The points were acquired on a regular grid in x (time) , y (frequency). In order to analyse the time evolution at specific frequencies (a fast rise, followed by an exponential decay), I would like to remove some of the noise present in the data. This noise, for a fixed frequency, can probably be modelled as random with gaussian distribution. At a fixed time, however, the data shows a different kind of noise, with large spurious spikes and fast oscillations (+ random gaussian noise). As far as I can imagine the noise along the two axes should be uncorrelated as it has different physical origins.
What would be a reasonable procedure to smooth the data? The goal is not to distort the data, but remove "obvious" noisy artefacts. (and can over-smoothing be tuned/quantified?) I don't know if smoothing along one direction independently of the other makes sense, or if it's better to smooth in 2D.
I've read things about 2D kernel density estimate, 2D polynomial / spline interpolation, etc. but I'm not familiar with the jargon or the underlying statistical theory.
I use R, for which I see many packages that seem related (MASS (kde2), fields (smooth.2d), etc.) but I cannot find much advice on which technique to apply here.
I'm happy to learn more, if you have specific references to point me to (I hear MASS would be a good book, but perhaps too technical for a non-statistician).
Edit: Here's a dummy spectrogram representative of the data, with slices along the time and wavelength dimensions.

The practical goal here is to evaluate the exponential decay rate in time for each wavelength (or bins, if too noisy).
