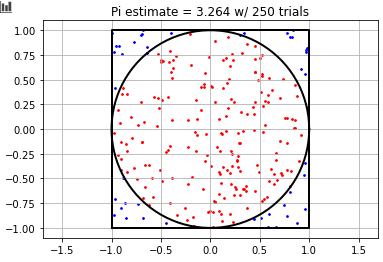
I trying to implement the classic Monte-Carlo simulation of $\pi$ to better understand how confidence intervals (CI) decrease with more trials. There are a lot of examples of how to do the former, but I haven't been able to find a simple example of calculating the CI for it, and my method is producing CIs that seem too small to be accurate. Here's my approach:
First, (using numpy) I draw $N$ random values between -1 and 1 in a uniform distribution to represent x and y coordinates. Then I calculate the radius of all points, find the number of points within a radius of 1, and calculate $\pi$ as the number of points within the circle, divided by $N$ multiplied by 4.
N = 500  # trials
X = np.random.uniform(-1, 1, N)
Y = np.random.uniform(-1, 1, N)
# Get radius of all points
rad_arr = np.sqrt((X ** 2) + (Y ** 2))
# Get boolean mask of points in circle
in_circle = rad_arr < 1.0
pi_est = 4 * np.sum(in_circle) / N
So far this is pretty standard and works perfectly. I'm now trying to understand how the confidence interval decreases as $N$ goes from 1 to 500. To do this I create the following array $\hat{\pi}_{est}$:
# Array of pi estimations from 1 to N
pi_est = 4 * np.cumsum(in_circle) / np.arange(1, N+1)
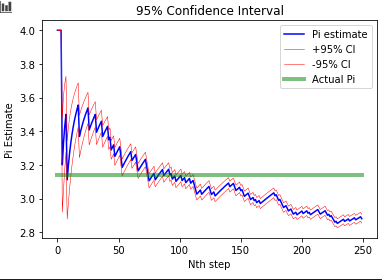
The array of the cumulative sum of points in the circle, divided by an array from 1 to $N$ creates an $N$-length array of the mean value of $\pi$ as $N$ goes from 1 to 500. Then I calculated an array of the corresponding 95% confidence interval with the following formula $1.96 \cdot \frac{\sigma_{\pi est_i}}{\sqrt{N_i}}$, where $\sigma_{\pi est_i}$ is the sample standard deviation for the estimate of $\pi$ at the $i$th step of N containing $N_i$:
N_arr = np.arange(N)
est_error = [1.96 * np.std(pi[:i]) / np.sqrt(i) for i in range(1, N+1)]
upper_ci = pi + est_error
lower_ci = pi - est_error
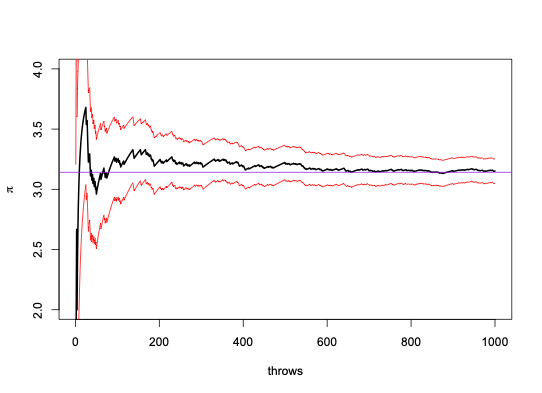
This last image looks really wrong. Specifically, the CI's are way to narrow at the beginning and not encompassing the actual value of $\pi$.
I have also tested a method where I draw $M$ draws of different $N$-point samples, so that each sample is independent from each other which produces better results:
M = 100
pi = np.zeros(M)
for i in range(M):
    N = i + 1  # trials
    X = np.random.uniform(-1, 1, N)
    Y = np.random.uniform(-1, 1, N)
    # Get radius of all points
    rad_arr = np.sqrt((X ** 2) + (Y ** 2))
    # Get boolean mask of points in circle
    in_circle = rad_arr < 1.0
    pi[i] = 4 * np.sum(in_circle) / N
But, the CIs still seem a little small to me, and I don't have a theoretical understanding of why this would work better then the previous method. The previous method also seems to be what all other examples of $\pi$ estimation via the Monte-Carlo method use (i.e Wikipedia's article on the Monte Carlo method).
Can someone explain what I'm doing wrong, and what I am misunderstanding about the Central Limit Theorem or sampling or CI calculation that is leading to this error?
---- UPDATE 1 ---
Based on suggestion by @EngrStudent, I've increased the sample size and did bootstrap resampling with replacement. Code:
M = 20000
X = np.random.uniform(-1, 1, M)
Y = np.random.uniform(-1, 1, M)

pi = np.zeros(M)
for i in range(M):
    N = i + 1  # trials
    _X = np.random.choice(X, size=N, replace=True)
    _Y = np.random.choice(Y, size=N, replace=True)
    # Get radius of all points
    rad_arr = np.sqrt((_X ** 2) + (_Y ** 2))
    # Get boolean mask of points in circle
    in_circle = rad_arr < 1.0
    pi[i] = 4 * np.sum(in_circle) / N
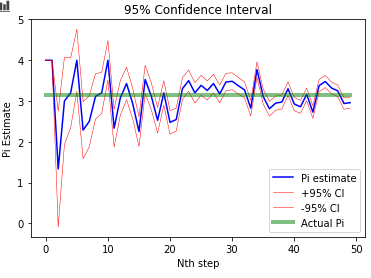
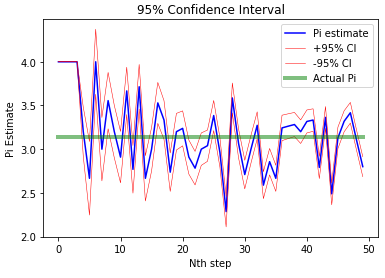
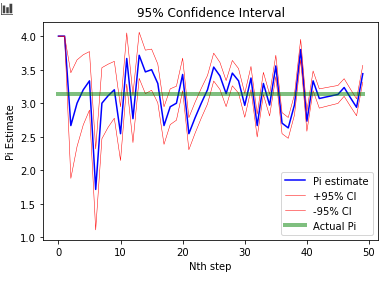
For the sake of legibility, I've cropped the image to the first 50 trials.
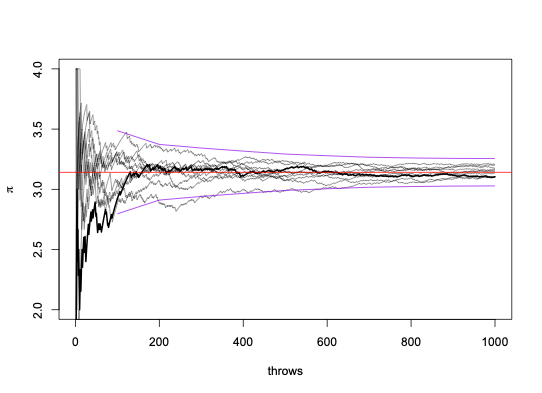
Here's my results with a sample size of 20,000:
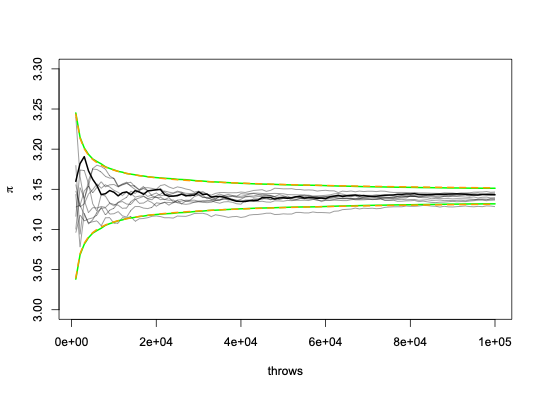
And here's one with 100,000:
I tried some different sample sizes, and it doesn't look to me like changing the sample size makes a difference, the CI's are looking more correct though. If this is correct, I'd still appreciate an explanation of the theory behind why this works!

