2
$\begingroup$

For my thesis I would like to compare different supervised machine learning algorithms based on their AUC score. My supervisor pointed out to also report the confidence intervals (CI) of the AUC scores. He told me that there is an article in which they calculate the CI based on the positive and negative samples in the dataset.

I think i have found the right article: Cortes, Corinna, and Mehryar Mohri. "Confidence intervals for the area under the ROC curve." Advances in neural information processing systems. 2005.

Although there are a lot of formula's in the article i am still not able to figure out how to 'simply' do it..

Could somebody help me out with this, or has a good example for it. Some numbers:

Training set: positive samples: 307 negative samples: 21156

Test set: positive samples: 77 negative samples: 21463

For me the ideal would be to calculate the CI without a bootstrapping method ad the data is on a computer which is not very accessible.

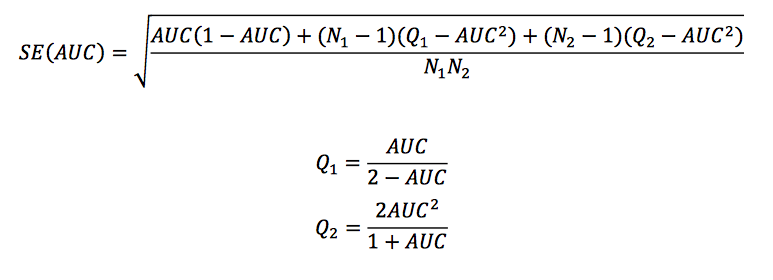
EDIT: SOLUTION I WAS LOOKING FOR, i think;): The answer i think i was looking for was in the article but through another article i sort of 'got it' the confidence interval can be calculated with the formula below.

enter image description here

Where N1 refers to the 'positive samples' and N2 to the 'negative samples' Then you use the confidence of you're choice (99% or 95%) and do: enter image description here

$\endgroup$
5
  • 1
    $\begingroup$ A related question was just answered. See that answer. $\endgroup$ Commented Jul 15, 2017 at 11:49
  • 2
    $\begingroup$ @FrankHarrell: You mean this ? $\endgroup$
    – usεr11852
    Commented Jul 15, 2017 at 12:21
  • 1
    $\begingroup$ Hi Frank, thanks for your answer. Actually i saw that question but it is not quite the way i would like to do it. As it is hard for me to do any computations on the data (as it is securily stored and not available just from home or my own computer) I was hoping someone could help me with the calculation the way they mention it apparently in the paper. Well at least my supervisor said you could calculate it based on the positive and negative examples, which i have at hand. (my supervisor is not available for 3 weeks tha why i started this post:)). if you might have some ideas, let me know! $\endgroup$
    – jjn
    Commented Jul 16, 2017 at 20:33
  • 1
    $\begingroup$ I think i have found my answer right in front of me, i have will add it to my question:) $\endgroup$
    – jjn
    Commented Jul 16, 2017 at 21:22
  • $\begingroup$ Are N1 and N2 the proportion of the sample or the numbers? $\endgroup$
    – Roland
    Commented Oct 4 at 14:27

0

Your Answer

By clicking “Post Your Answer”, you agree to our terms of service and acknowledge you have read our privacy policy.