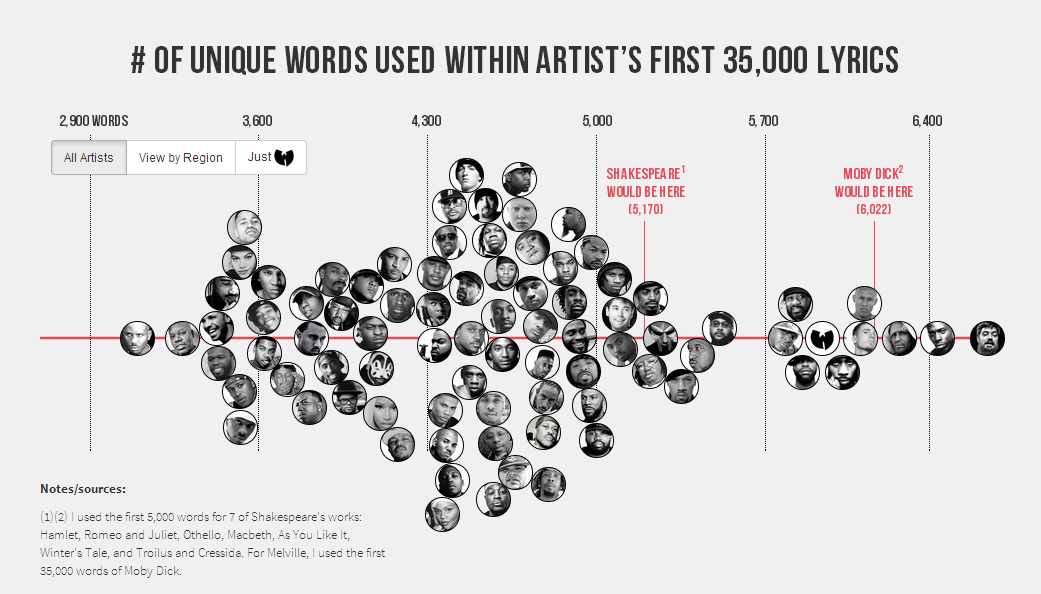
What type of graph is this developer using?

Copied from here.
It is the beeswarm version of a stripchart, with photos of the artists in place of dots.
There is a single numeric axis against which values are plotted and there is some mix of stacking and jittering to separate points that might occlude or overlap each other. Short of the photos, which make the graph distinctive, I have come across the following names for broadly similar plots:
barcode charts
beeswarm plots
circle plots
column scatter plot
data distribution graph
dispersal graphs
dispersion diagrams
dit plots
dot array charts
dot charts
dot diagrams
dot histograms
dot patterns
dot plots
instance chart
line charts
line plots
linear plots
needle plots
number-line plots
one-axis data distribution graph
one-dimensional scatter plots
oneway graphs
oneway plots
point graphs
raster plots
strip charts
strip plots
stripe graph
stripes plot
unidimensional scatter plots
univariate scatter plots
Wilkinson dot plots
plus several variations of those running words together or using different hyphenation, which I am not quite crazy enough to collect.
Stata users might care to note that these are documented in the help for my stripplot command available from SSC.
This is a dot chart with some non-random jittering for legibility.
It it not a dot plot, though there's some superficial similarity.