11
$\begingroup$

I have already used the logit transform on my outcome variables (which are displayed in percentages). However, this obviously gives me -INF values and since my data includes a lot of zeros in some instances, this makes it hard to analyse.

I have now tried an empirical logit transform, adding the smallest non-zero promotion to the numerator and denominator of my variables to remove the -INF values (as suggested in http://www.esajournals.org/doi/abs/10.1890/10-0340.1).

However, now my data are very non-normal again. I have tried experimenting with error terms to add to the logit transform but since have had no luck.

Is there any way I can find a value to add to my transformation to ensure normality?

$\endgroup$
4
  • 3
    $\begingroup$ A worthy option for your consideration is a generalized linear model. Please search our site for threads on GLMs. If you still want to transform the response, then search for threads about transformations, logarithms, and regression: many of them explicitly discuss whether and how to add a "start value" to the data before re-expressing them. $\endgroup$
    – whuber
    Commented Jul 30, 2014 at 19:13
  • $\begingroup$ If your outcome variables are 'displayed in percentages' this suggests that they aren't originally percentages. Presumably they are counts. @whuber is suggesting starting instead with a logistic (or multinomial logistic) regression model, for which even conditional normality is not a requirement. $\endgroup$ Commented Jul 30, 2014 at 22:36
  • $\begingroup$ Thanks for these. However, although I do have the raw counts, the particular research I am carrying out means that I would expect that the raw counts would increase with my predictor variables. Therefore, percentages are giving me a more reliable measure in my analyses. $\endgroup$ Commented Jul 31, 2014 at 21:27
  • $\begingroup$ As per @whuber... Are you sure this isn't a binomial process? I would pick a trials count for each record and model it as success and failures. glm binomial supports this. If it isn't binomial in nature, perhaps try inverse hyperbolic sine transformations worthwhile.typepad.com/worthwhile_canadian_initi/2011/07/… $\endgroup$
    – Chris
    Commented Dec 11, 2017 at 18:27

2 Answers 2

17
$\begingroup$

I've had luck with setting epsilon to half of the smallest non-zero value and replacing all 0 values with epsilon and all 1 values with 1-epsilon. Then apply the logit transformation.

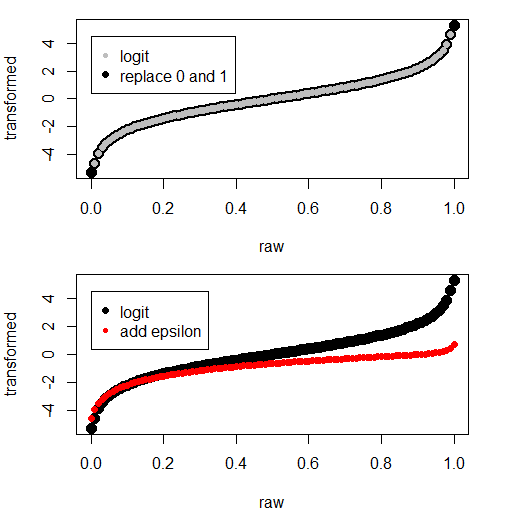
This method keeps the original form of the logit transformation, but allows 1 and 0 to be transformed to values that match the overall shape of the intended transformation (note the black dots in the figure at raw=0 and 1). In particular, it preserves the quality that 0.5 is transformed to 0, and the rest of the values are symmetric.

On the other hand, adding the smallest non-zero value as described in the paper changes the shape of the curve and destroys the symmetry.

Comparing two methods of ways to adjust the logit transformation to deal with zeros

$\endgroup$
3
  • 1
    $\begingroup$ Welcome to our site! This thoughtful, well-illustrated post is a useful contribution. $\endgroup$
    – whuber
    Commented Jul 30, 2014 at 19:14
  • $\begingroup$ Thanks! I will give this a go, although I have been experimenting with zero/one inflated beta regression too. $\endgroup$ Commented Jul 31, 2014 at 21:28
  • $\begingroup$ Is that right that the empirical logit isn't centered at 0? This equation log((0.5 + eps)/(1 - 0.5 + eps)) always gives me 0 no matter what eps is. I also plotted logit vs empirical logit curves and empirical logit is symmetric as well, but the curve is a bit less steep as you get toward the edges for large eps. Using a smaller eps can correct this, but then the points near 0 and 1 will get increasingly pulled closer to +/- infinity. Still, it behaves pretty well for values like 1e-3 to 1e-5 $\endgroup$
    – CHP
    Commented May 10, 2019 at 9:14
2
$\begingroup$

One approach, which would solve the problem you are having, is to use a robust regression method on the raw, untransformed values. For example, in R, you could do the following:

example = data.frame(outcome = c(0,0,0.3,0.7,1), 
                     predictor = c('left','left','left','right','right'))
m = glm(outcome ~ predictor,example,family=quasibinomial())
summary(m)
$\endgroup$

Your Answer

By clicking “Post Your Answer”, you agree to our terms of service and acknowledge you have read our privacy policy.

Not the answer you're looking for? Browse other questions tagged or ask your own question.