I'm following an example from the book "R by Example", where they talk about two-way ANOVA.
The database used in poison. The analysis is:
L <- aov(Time ~ Poison * Treatment, data = poison)
Further on, the book says:
The residual plots suggest a reciprocal transformation of the response (poison survival time) (The dependent variable
Time)...
That is, a more appropriate variable would be 1/Time.
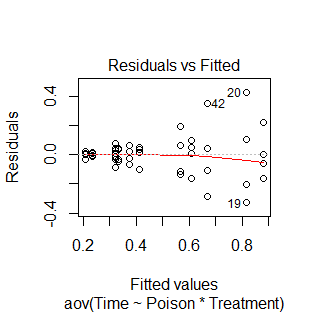
Here is the residual plot, using plot(L):

I guess that the reciprocal relationship is evident by the gradually increasing residuals. Why is this correct?
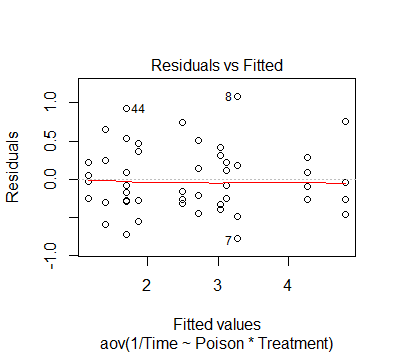
When making the reciprocal model using L <- aov(1/Time ~ Poison * Treatment, data = poison), the residual plot no longer has this property:

So my questions is how could I've known that the special pattern in the first residual plot suggests a reciprocal relationship?
