1
$\begingroup$

I am trying to study the relationship between two parameters say A and B for an image.

For a single scene S1, I take 20 images back-to-back where all 20 images will have different values of parameter A. Now for each of 20 images I calculate parameter B. Thus, I have 20 pairs of type (A, B).

Now I plot all 20 (A, B) points.

I repeat the same experiment for different scenes and get curves which look similar. This is how all the curves look like: Example curve

I want to establish a formula linking parameters A and B. I decided to use curve-fitting (using Python) and tried to fit a polynomial curve ax^3 + bx^2 + cx + d. This curve fits very well most of the time, but for each graph I get different values of a, b, c and d. The values vary too much.

Next, I tried fitting a logarithmic curve a + b * log(x). This time, the curve does not always fit very well to the points and I get values of a varying from 7 to 9 and values of b varying from 1 to 3.

Basically my question is how should I go about establishing a formula between A and B so that for a given image if I have value of parameter A, I can get a fair estimate of parameter B?

Following are sample data points for parameter A and B respectively:

A = [0.9937759763768161, 0.9929152405279837, 0.9931066175878016, 0.9931907432668384, 0.9423758456906559, 0.9423108644829163, 0.8950448401371942, 0.891681991390553, 0.8465614087427353, 0.805345556595838, 0.7662998080069015, 0.7314247255399298, 0.6984452544936371, 0.6367965670718196, 0.5836881571632964, 0.4988198092947567, 0.4194923476465984, 0.33213924154453156, 0.22415360562956688, 0.11320564921875846]

B = [7.1924877201252109, 7.2179850206954717, 7.2104191677025398, 7.2052736759243174, 7.3607976206941599, 7.3592349109473805, 7.4487191455800605, 7.4675352495474385, 7.5513534938320701, 7.5711664827868503, 7.5349750797299357, 7.4872747506190747, 7.3718597264801442, 7.2183573562424082, 7.0814398229980107, 6.7632755526248989, 6.4009932656267612, 5.8645747001035851, 4.9334148033003622, 3.3773511239822742]

The data points are in order with each other.

$\endgroup$
11
  • $\begingroup$ As cross-posting on SE sites is discouraged, it's good practice to delete your question on SO. $\endgroup$
    – Nick Cox
    Commented Jun 3, 2015 at 11:45
  • 1
    $\begingroup$ In statistical terms, your two "parameters" are best thought of as variables. As you have just 20 pairs for an image, why not post sample data here? It's rare that a cubic has any scientific value, unless there are independent grounds for thinking that it should hold (some would say the last clause is empty). For monotonic relationships, it is not especially helpful. $\endgroup$
    – Nick Cox
    Commented Jun 3, 2015 at 11:48
  • $\begingroup$ When you say fitting "exactly", I presume you just mean "very well". $\endgroup$
    – Nick Cox
    Commented Jun 3, 2015 at 11:49
  • 2
    $\begingroup$ You get very different coefficients for each image (no surprise) but seem to want a general formula for all images. How do you reconcile those goals? That is: you haven't given a reason why the same functional form should be expected to perform well for all images. One statistical approach is that you pool all the $a, b$ pairs and then estimate, or at least check to see what that looks like. Another, better but more challenging, is that you use properties of the images to help model image-to-image variation in $a, b$, $\endgroup$
    – Nick Cox
    Commented Jun 3, 2015 at 11:54
  • $\begingroup$ @NickCox, Thanks for your input. I've deleted the question from SO. I'll post the sample data. And yes it should be fitting "very well" and not "exactly" :). $\endgroup$
    – kunal18
    Commented Jun 3, 2015 at 14:02

1 Answer 1

2
$\begingroup$

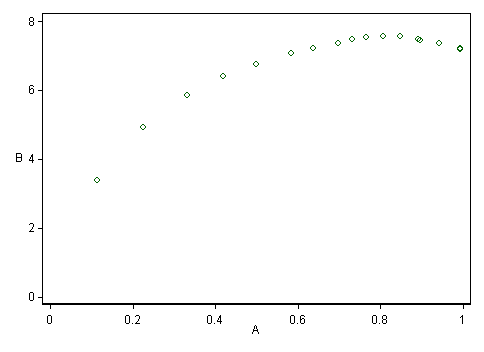
This is more by way of extra comments than a full answer, but I have a graph and summary statistics that can only be well shown in an answer.

There are more decimal places here than may make sense, but they show up details that could be crucial:

    Variable |       Obs        Mean    Std. Dev.       Min        Max
-------------+--------------------------------------------------------
           A |        20    .7150387    .2726499   .1132056    .993776
           B |        20    6.880924    1.051601   3.377351   7.571167
  1. The summaries for A are suggestive of a measure bounded by 0 and 1, but what are the limits? Are 0 and 1 defined in principle? Attainable in practice? What about values beyond 0 and 1?

  2. The range of possibilities for B is not clear. But again any comment you can make about bounds in principle and bounds in practice could be very helpful.

  3. The sample data make clear to me that there is a subtle but definite turning point in this case around A $\sim 0.8$, so contrary to comments earlier made. relationships cannot be said to be all monotonic.

enter image description here

Note that a curve of the form $a + b \log A$ will not capture the turning-point, as it can only be monotonic. (Presumably your $x \equiv A$.) Quadratics and higher polynomials can naturally possess turning points.

  1. To me the points suggest a well-defined relationship: the problem is merely that it seems hard to suggest a functional form for that on the information to date! As in points 1 and 2, whatever information you can provide on what the data are, and how they should behave, should help greatly. Subject-matter comments can sometimes rule some analyses out as physically (biologically, ...) absurd or unhelpful and sometimes rule analyses in as being the opposite. My most specific concern is that an upper limit of 1 should feature even in simple modelling if it is a real limit.
$\endgroup$
5
  • $\begingroup$ I will answer your points one by one. Yes the values of A are bounded by 0 and 1. $\endgroup$
    – kunal18
    Commented Jun 4, 2015 at 9:32
  • $\begingroup$ Hi Nick, to better answer the points you have raised, you can refer to detailed information in this question here: dsp.stackexchange.com/questions/24264/…, you will get to know what exactly the parameters are and other things. Thanks! $\endgroup$
    – kunal18
    Commented Jun 24, 2015 at 5:54
  • $\begingroup$ Thanks for the cross-reference. You add much substantive detail but I don't think I can push my answer forward. Your stance on failure of monotonicity seems to be just that you don't understand it. However, it appears to be real in the one dataset given here. $\endgroup$
    – Nick Cox
    Commented Jun 24, 2015 at 8:18
  • $\begingroup$ Yes. The relationship is not at all monotonic. The turning point almost always appeared after ~0.80 key-value. The keyvalues above 0.80 are not much useful to me, so I discarded them in favor of monotonicity. $\endgroup$
    – kunal18
    Commented Jun 24, 2015 at 10:29
  • $\begingroup$ Sorry, but I am no longer much focused on this old thread. To get others' attention, you would need to add content to the question; otherwise this is just an old thread, abandoned for 20 days, that most active members would not scan. $\endgroup$
    – Nick Cox
    Commented Jun 24, 2015 at 10:38

Your Answer

By clicking “Post Your Answer”, you agree to our terms of service and acknowledge you have read our privacy policy.

Not the answer you're looking for? Browse other questions tagged or ask your own question.