In other words, instead of having a two class problem I am dealing with 4 classes and still would like to assess performance using AUC.
-
$\begingroup$ Is dimension reduction an option? $\endgroup$– ShaneCommented Aug 27, 2010 at 1:59
-
3$\begingroup$ we have 4 classes, not really $\endgroup$– CLOCKCommented Aug 27, 2010 at 3:03
-
1$\begingroup$ Weka does this perfectly, using the one against all class strategy. $\endgroup$– user14474Commented Sep 28, 2012 at 20:45
5 Answers
It seems you are looking for multi-class ROC analysis, which is a kind of multi-objective optimization covered in a tutorial at ICML'04. As in several multi-class problem, the idea is generally to carry out pairwise comparison (one class vs. all other classes, one class vs. another class, see (1) or the Elements of Statistical Learning), and there is a recent paper by Landgrebe and Duin on that topic, Approximating the multiclass ROC by pairwise analysis, Pattern Recognition Letters 2007 28: 1747-1758. Now, for visualization purpose, I've seen some papers some time ago, most of them turning around volume under the ROC surface (VUS) or Cobweb diagram.
I don't know, however, if there exists an R implementation of these methods, although I think the stars() function might be used for cobweb plot. I just ran across a Matlab toolbox that seems to offer multi-class ROC analysis, PRSD Studio.
Other papers that may also be useful as a first start for visualization/computation:
- Visualisation of multi-class ROC surfaces
- A simplified extension of the Area under the ROC to the multiclass domain
References:
1. Allwein, E.L., Schapire, R.E. and Singer, Y. (2000). Reducing multiclass to binary: A unifying approach for margin classifiers. Journal of Machine Learning Research, 1:113–141.
I recently found this pROC package in R which plots a multiclass ROC using the technique specified by Hand and Till (2001). You can use the multiclass.roc function.
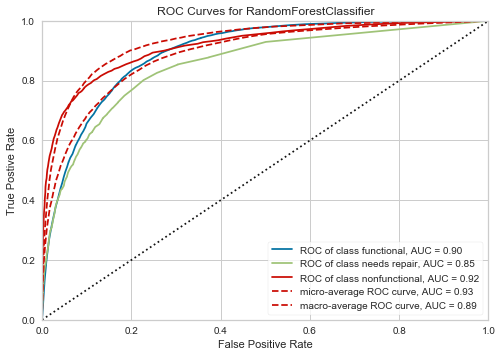
You need to specify your classifier to act as one-vs-rest, and then you can plot individual ROC curves. There's a handy library for doing it without much work in python called yellowbrick.
Check out the docs with a minimal reproducible example.
The result looks like this (source)
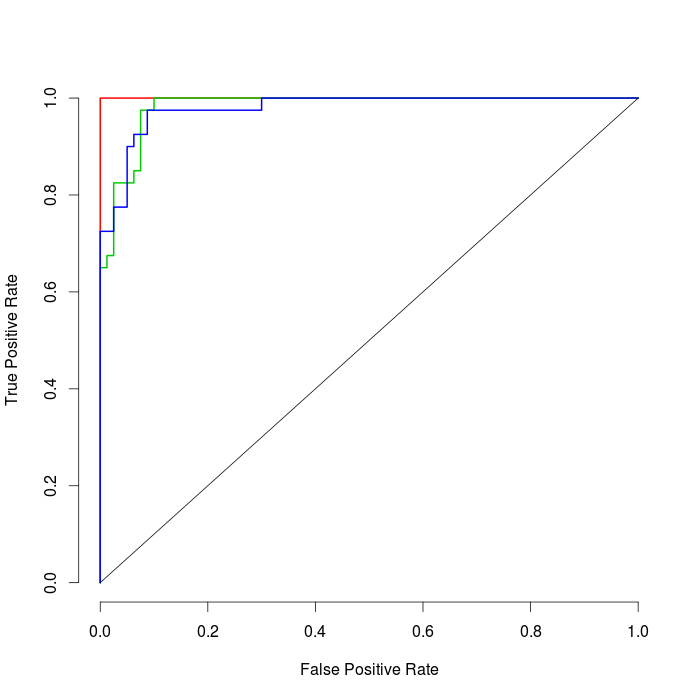
The answers here are pretty complete, but I still would like to add my 5 cents. In this question you can find an example of R code for producing ROC Curves using One-Vs-All Approach and the ROCR R library.
This is the plot from that answer:

While the math is beyond me this general review article has some references you will likely be interested in, and has a brief description of multi-class ROC graphs.
An introduction to ROC analysis by Tom Fawcett Pattern Recognition Letters Volume 27, Issue 8, June 2006, Pages 861-874
Link to pdf as provided by gd047- thanks
-
2$\begingroup$ I would say the same providing another link google.gr/… $\endgroup$– YorgosCommented Aug 27, 2010 at 6:40
-
1$\begingroup$ And here is another one, directly related to multi-class problem: Multi-class ROC analysis from a multi-objective optimisation perspective, Pattern Recognition Letters 2006 27(8): 918-927 (j.mp/9AMgzq). $\endgroup$– chlCommented Aug 27, 2010 at 7:38
-
1$\begingroup$ Thanks for the other links, apparently that whole issue is popular, and its archive on science direct can be found here sciencedirect.com/… $\endgroup$– Andy WCommented Aug 27, 2010 at 13:17

