3
$\begingroup$

I use auto.arima function to model the below provided time series data. At the end of the analysis, the best model is given as ARIMA(1,2,1). The log- likelihood=93.69 is positive which is unusual. It is clear for me that the log-likehood is not as same as the probability. But how can this originate from the analysis? Does it depend on the data? Or just due to sign convention?

  srs=c(8.6,9.8,11.2,12.4,13.5,15.7,18.6,21.1,22.3,23.6,24.6,26.3,28.3,29.6,33.3,36.4,40.5,44.9,48.4,52.6,56.8,60.5,67.2,73.4,77.8,85.6,94.8,105.5,
114.0,118.5,128.3,126.9,132.6,141.2,150.0,160.8,174.6,190.0,198.1,194.1,210.4,230.3,242.4,246.4,257.2)

x=ts(srs,frequency=1)

fit=auto.arima(x,d = 2,D = 0,start.p=0, start.q=0, max.p=5, max.q=5,stationary=FALSE,seasonal=FALSE,stepwise=TRUE,trace=TRUE,approximation=FALSE,allowdrift=TRUE,ic="aicc",lambda=-0.049)

library(forecast)
tx=BoxCox(x, -0.049)

result of transformation

 tx=(2.042209,2.159383,2.278396,2.368590,2.443563,2.575967,2.723460,2.832405, 2.879977, 2.928574, 2.964082,3.021106, 3.083437, 3.121522, 3.221002, 3.295802, 3.385064, 3.470876, 3.533058, 3.601728, 3.664871, 3.716566,3.802248, 3.873901, 3.921001, 3.998007, 4.079888, 4.165227, 4.226782, 4.257449, 4.320209, 4.311558, 4.346176,4.395557, 4.442923, 4.497221, 4.561284, 4.626783, 4.659033, 4.643283, 4.705451, 4.774832, 4.814009, 4.826510,4.859228)

result of density function given observation

dnorm(tx ,mean(tx), sd(tx),log=TRUE)
Time Series:
Start = 1 
End = 45 
Frequency = 1 
[1] -2.7168796 -2.4462962 -2.1917838 -2.0125389 -1.8724951 -1.6450191 -1.4214597 -1.2765217 -1.2186144
[10] -1.1628381 -1.1242424 -1.0660746 -1.0078703 -0.9750711 -0.8992890 -0.8517306 -0.8055615 -0.7720362
[19] -0.7543945 -0.7414067 -0.7354801 -0.7349191 -0.7424969 -0.7569828 -0.7705473 -0.7996330 -0.8399630
[28] -0.8923108 -0.9366056 -0.9607175 -1.0143004 -1.0065755 -1.0381350 -1.0861521 -1.1355218 -1.1961059
[37] -1.2730668 -1.3578864 -1.4019282 -1.3802323 -1.4679575 -1.5724597 -1.6345414 -1.6548185 -1.7089570
$\endgroup$
4
  • $\begingroup$ You're welcome - I turned my comment into an answer so you can accept it (if it covers your needs). It's interesting that, in the document you found, likelihood is set equal to probability only up to a multiplicative constant! $\endgroup$
    – Paul
    Commented Oct 16, 2015 at 12:29
  • $\begingroup$ Thx for your reply. It could be also true. As far as I know, likelihood is not as same as the probability. I found the corresponding information concerning positive log-likelihood. cimat.mx/reportes/enlinea/D-99-10.html First, I have to be sure, your comment is the answer. I'll check the R documentation. $\endgroup$
    – Dirk
    Commented Oct 16, 2015 at 12:33
  • 3
    $\begingroup$ Most likelihoods are probability densities. They can be arbitrarily large. $\endgroup$
    – whuber
    Commented Oct 16, 2015 at 13:36
  • $\begingroup$ Ah yes, good point... $\endgroup$
    – Paul
    Commented Oct 16, 2015 at 16:57

2 Answers 2

3
$\begingroup$

It is very common for statistical software to report a log-likelihood which is actually the log-probability plus an additive constant. This is because constants that do not affect the solution are commonly omitted to simplify the log-likelihood formula during model fitting. In fact, the traditionally defined likelihood function need not be equal to the generating probability, only proportional. Omitted constants could thus explain why your log-likelihood is reported as positive. Unfortunately this convention is frequently undocumented, and you may need to examine the likelihood function and the source code to discover whether this is what is occurring in your case.

$\endgroup$
4
  • 5
    $\begingroup$ In addition, there is no general rule that the likelihood as calculated must be less than 1; hence no general rule that log-likelihood must be negative. I've not looked at this particular model. $\endgroup$
    – Nick Cox
    Commented Oct 16, 2015 at 12:33
  • $\begingroup$ This is a nice detail to know about likelihoods! I added it to the post. $\endgroup$
    – Paul
    Commented Oct 16, 2015 at 12:40
  • $\begingroup$ I editted further analysis about the data. From the data, I observe that I cannot get positive log-likelihood since all logged values of probability density function given the observation are negative. It seems that I cannot get a postive log-likelihood value. How can I calculate a positive value? $\endgroup$
    – Dirk
    Commented Oct 18, 2015 at 13:32
  • $\begingroup$ Early comments and answers assured you that a positive log-likelihood is not intrinsically problematic. Now we assure that that the same applies to negative log-likelihood.... $\endgroup$
    – Nick Cox
    Commented Oct 18, 2015 at 13:54
0
$\begingroup$

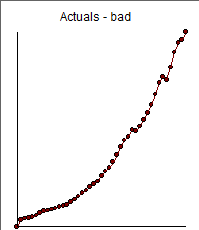
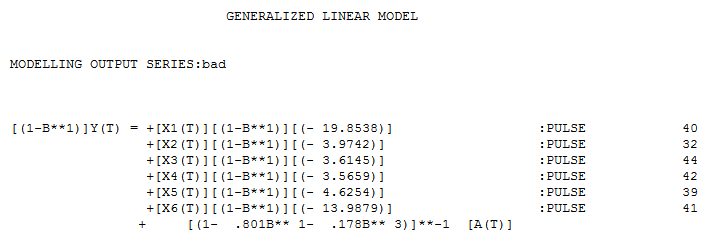
An appropriate model for your data would require a remedy for the visually obvious change in error variance. enter image description here Additionally there a few clear anomalies that need to be treated otherwise you are leaning on ARIMA and usually a bad ARIMA. There is agreement on the need for double differencing but I suspect your AR(1) coefficient and MA(1) coefficient have nearly equal absolute value thus are probably redundant . Here is an alternative model enter image description here with an AR polynomial that is "near" to a differencing factor (.8). Apologies to all for not precisely answering your question about the sign of the log-likelihood statistic.

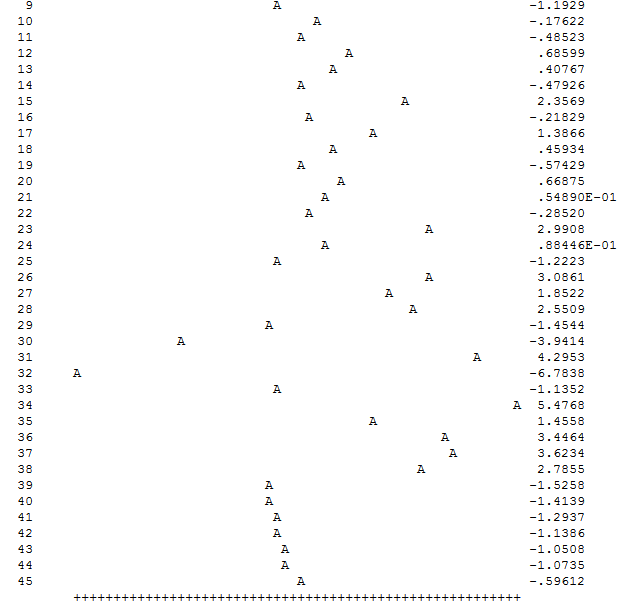
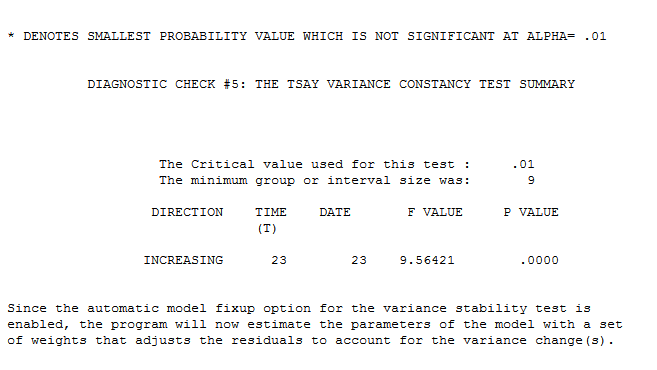
EDITED to present the detection of the variance change , Here is a plot of the residuals before the variance change ( your model probably has a similar disappointing set of residuals ) enter image description here leading to the following analysis enter image description here . Since the data requires a Weighted Least Squares analysis summary statistics are not delivered as the metric has changed.

$\endgroup$
5
  • $\begingroup$ Thx for your reply. I recognized from the output that the series is once differenced for the "generalized linear model" and there is not any agreement on the number of differencing. Actually, I am interested in getting positive log-likelihood which is not wrong. How could this be possible/ interpreted? I don't see the magnitude of log-likelihood in your output. $\endgroup$
    – Dirk
    Commented Oct 15, 2015 at 20:47
  • $\begingroup$ my model has a differecing factor AND an AR polynomial that has .8 for lag1 which is nearly 1.0 which is then nearly an additional differencing operator thus 2 $\endgroup$
    – IrishStat
    Commented Oct 15, 2015 at 21:19
  • 3
    $\begingroup$ I can't see here any mention of likelihood either. How to model these data best? is a valid question, but not what was asked. $\endgroup$
    – Nick Cox
    Commented Oct 15, 2015 at 23:14
  • $\begingroup$ which is why I apologized " Apologies to all for not precisely answering your (vague) question". $\endgroup$
    – IrishStat
    Commented Oct 15, 2015 at 23:34
  • $\begingroup$ The question is for answering a specific case in which the log-likehood is calculated to be positive. The comments are not useful. $\endgroup$
    – Dirk
    Commented Oct 16, 2015 at 11:38

Your Answer

By clicking “Post Your Answer”, you agree to our terms of service and acknowledge you have read our privacy policy.

Not the answer you're looking for? Browse other questions tagged or ask your own question.